|
Leffingwell
& Associates
|
 Rayven GC/MS Consulting Fragrance & Flavor |
2013- 2017 Estimated Sales in
Millions
(Estimates for Year 2017 as
of August 22, 2018)
(Estimated Market Shares in
U.S. $)
|
Leffingwell
& Associates
|
Rayven GC/MS Consulting Fragrance & Flavor |
2013- 2017 Estimated Sales in
Millions
(Estimates for Year 2017 as
of August 22, 2018)
(Estimated Market Shares in
U.S. $)
.. Company 2013 2013 Est.
2013 2014 2014 Est.
2014 2015 2015 Est.
2015 2016 2016 Est. 2016 2017 2017 Est. 2017 Rank .. Country =US $ Market Share1 Country =US $ Market Share1 Country =US $ Market Share1 Country =US $ Market Share 1 Country =US $ Market Share 1 Source 1 Givaudan 4,369 CHF $4715.9 19.7% 4404 CHF $4818.5 19.4% 4396 CHF $4575.5 19.0% 4663.0 CHF $4734.1 19.4% 5051.0 CHF $5132.8 19.5% 2(3) Firmenich 2,952 CHF $3186.4 13.3% 3008.0 CHF $3291.1 13.2% 3200.0 CHF $3330. 7 13.8% 3340 CHF $3391.0 13.9% 3610 CHF
(EST) $3668.4
(EST) 13.9%
(EST) 3 IFF $2952.9 $2952.9 12.4% $3088.5 $3088.5 12.4% $3023.2 $3023.2 12.5% $3116.4 $3116.4 12.7% $3398.7 $3398.7 12.9% 4 Symrise 1830.4 € $2431.6 10.2% 2120.1 € $2818.0 11.3% 2053.9 € $2279.3 9.5% 2089.6 € $2312.3 9.5% 2365.0 € $2672.6 10.2% 5 Mane SA 723.2 € $960.7 4.0% 769 € $1022.1 4.1% 947.6 € $1051.6 4.4% 1058.0€ $1170.7 4.8% 1155.8 € $1306.1 (note) 5.0% 6 Frutarom $673.7 $673.7 2.8% $819.5 $819.5 3.3% $872.8 $872.8 3.6% $1067.5 $1067.5 4.4% $1,271.4 $1,271.4 4.8% 7(4) Takasago ¥122,403 $1256.3 5.3% ¥124,816 $1182.4 4.8% ¥134,228 $1109.1 4.6% ¥128,549.0 $1184.8 4.8% ¥132,904 $1,185.4 4.5% 8 (6,7) Sensient Flavors $736.1** $736.1** 3.1% $724.7** $724.7** 2.9% $667.9** $667.9** 2.8% $653.8** $653.8** 2.7% $618.8** $618.8** 2.4% 9 Robertet SA 389.5€ $517.4 2.2% 390.1€ $518.4 2.1% 435.3€ $483.1 2.0% 468.0€ $517.9 2.1% 504.4 € $570.0 2.2% 10 (5) T. Hasegawa ¥45,104 $462.9 1.9% ¥44,917 $425.5 1.7% ¥47,288 $390.2 1.6% ¥47,591 $438.6 1.8% ¥48,001 $428.1 1.63% 11 (4) Huabao Intl. 3,167.6 HKD* $408.4 1.7% 3,294.1 HKD* $424.5 1.7% 2,485.5 HKD* $320.6 1.3% 2,504.2 RMB. $377.2 1.5% 2,812.1 RMB $416.2 1.58% ... Top 11 Totals $18,294.0 76.5% $19,124.8 76.8% $18,104.0 75.1% $18,964.8 77.6% $20,668.5 78.6% All Others $5,613.6 23.5% $5,765.2 23.2% $5,996.0 24.9% $5,485.2 22.4% $5,631.5 21.4% Total Market $23,908 $24,890 $24,100 $24,450 $26,300
** Results for Sensient Flavors & Fragrances excludes all non
F&F items
Currency
Currency
Currency
Currency
Currency
Note - Using Mane's internal actual average
exchange rate they reported the U.S. dollar equilalent as
USD $1,306.9 million for 2017 and as USD $1,172 million in 2016
and as USD $1,051 million in 2015
Note - We have restated Takasago's sales
figures for 2013-2017 to eliminate certain revenue items such as non
F&F fine chemicals such as pharmaceutical intermediates as well
as real estate revenues.
NOTICE: Historically all foreign currency calculations for the tables were based on December 31 rates for the year indicated. For some years this distorted the the actual performance in US dollars as we have seen significant currency swings within a given year. This was particularly prevalent in 2014, where a EUR/USD swing of nearly 13% and a CHF/USD swing of ~12% occured between July 1 and December 31 2014. Accordingly, after discussions with various industry financial experts, we are now using the "yearly average" exchange rates (which more closely approximates that normally used in the companies). All years in the table for 2010-2014 and 2011-2015 and 2012-2016 and 2013-2017 have now been restated using the FOREX yearly average rates as shown in the table below. Prior tables available have not been restated. Note that Huabao decided for 2015-2016 and 2016-17 to use the Chinese RMB = CNY instead of the Hong Kong dollar (HKD) as the reporting curency.
|
Currency |
2013 |
2014 |
2015 |
2016 |
2017 |
|
EUR/USD |
1.328464 |
1.329165 |
1.109729 |
1.106560 |
1.130051 |
|
CHF/USD |
1.079397 |
1.094111 |
1.040833 |
1.015257 |
1.01619 |
|
JPY/USD |
0.010264 |
0.009473 |
0.008263 |
0.009217 |
0.008919 |
|
HKD/USD |
0.128921 |
0.128955 |
0.12899 |
0.128827 |
0.128327 |
|
RMB/USD |
0.150594 |
0.147999 |
For 2017, we estimate that the total market grew a bit more than 7% in US $ from 2016. This follows several years of lackluster growth. In addition, the inclusion of certain cosmetic ingredients has become a significant factor for some of the companies with fragrance sales. For 2017, Symrise estimated the traditional market for flavorings and fragrances (F & F market), at � 23.3 billion (~= U.S $26.3 Billion) in 2017, according to calculations made by the IAL Consultants market research institute. This did not include aroma chemicals and cosmetic ingredients, which, according to the current reports from TechNavio/Infiniti (December 2016 issue) and Global Industry Analysts (GIA; 2015 edition), achieved sales of approximately � 5.2 billion (= ~ U.S. $5.9 billion) globally. And perhaps most important, we saw a dramatic increase in the global economy in the year following the U.S. elections in November of 2016.
The Symrise Group increased sales by 3.2 % to � 2,996.3 million (2016: � 2,903.2 million). In 2017, Symrise Sales in the Flavor segment increased to � 1,101.9 million in the year under review (2016: � 1,015.9 million), while the Scent & Care segment achieved total sales of � 1,263.1 million (2016: � 1,311.3 million). Nutrition sales were � 631.3 million (2016: � 576.0 million) - but Nutrition sales are not considered F&F sales (and thus are not included in the table above).
In 2017 Frutarom continued to have accelerated growth as it made 12 Strategic Acquisitions. Total Sales for Frutarom were $1,362.4 million of which the sales from core activities grew by 19.1% to U.S. $1,271.4 million. As "core activities" are considered as the F&F portion of the Frutarom business, we report the adjusted Frutarom F&F sales for 2017 as U.S. $1,271.4 million.
Sensient Flavors & Fragrances Group Full Year 2017 Results - Sales of Traditional Flavors & Fragrances were $618.8 million and $651.9 million for the full years of 2017 and 2016, respectively. (Sensient historically has included other items such as dehydrated vegetables and colors in the F&F group, these are not included in the table above).
IFF Reports Full Year 2017 Results - Reported net sales for the full year totaled $3.4 billion, an increase of 9% from $3.1 billion in 2016. Excluding the impact of foreign exchange, currency neutral sales also increased 9% over the prior year, including approximately five percentage points related to our recent acquisitions. Reported operating profit for the full year was $581 million versus $567 million reported in 2016, an increase of 2%.
Givaudan Group full year 2017 sales were CHF 5,051 million, an increase of 4.9% on a like-for-like basis and 8.3% in Swiss francs when compared to 2016. Flavour Division sales were CHF 2,708 million, an increase of 5.3% on a like-for-like basis and 11.3% in Swiss francs. Fragrance Division sales were CHF 2,343 million, an increase of 4.5% on a like-for-like basis and 5.1% in Swiss francs.
Firmenich sales for the 2016-2017 year period ending June 30, 2017 were CHF 3.34 billion. The figure in our table is our estimate of sales for the 2017-2018 year (our estimate is CHF 3.61 billion).
Results for Mane SA were kindly provided to us on April 16, 2017 by Mane's group CFO. Reported sales were 1155.8 €. Using Mane's actual average exchange rate the reported the U.S. dollar equivalent as USD $ 1,306.9 million (please note that in the tabulation above that using the Forex average exchange rate gives a value of $ 1,306.1 million USD)
Takasago - For the fiscal year from April 1st, 2017 to March 31st, 2018 consolidated net sales rose 3.5% year on year, to ¥141,592 million. Looking at the business segment, net sales in the flavors business rose 1.5% year on year, to ¥83,312 million, due to the strong performance of the German subsidiary. In fragrances business, net sales rose 6.3% year on year, to ¥38,183 million, due mainly to the solid performance of the French subsidiary. In the aroma ingredients business, net sales rose 8.4% year on year, to ¥11,409 million due to the steady performance of menthol, the mainstay product of this business segment. In the fine chemical business, net sales rose 6.7% year on year, to ¥7,246 million, due to growth in the sales of pharmaceutical intermediates. In the other business, the real estate business, net sales rose 1.1%, to ¥1,441 million. Note that the revenue from fine chemical business and the real estate business are excluded from the F&F sales.
It should be noted that for 2017, both Kerry Ingredients & Flavors and ADM should possibly be in the Top Ten. However, the inclusion of so many other non-flavor ingredients in their sales numbers makes it impossible to truly estimate the F&F portion of sales.
The Wild Flavors and Specialty Ingredients (WFSI) segment of ADM engages in the manufacturing, sales, and distribution of specialty products including natural flavor ingredients, flavor systems, natural colors, proteins, emulsifiers, soluble fiber, polyols, hydrocolloids, natural health and nutrition products, and other specialty food and feed ingredients. The WFSI segment also includes the activities related to the procurement, processing, and distribution of edible beans. In 2017 Wild Flavors and Specialty Ingredients revenues decreased nearly 5% due to lower sales volumes. In 2017 Wild Flavors and Specialty Ingredients (WFSI) operating profit increased 3%. The continuing strong demand for flavor ingredients and flavor systems across all regions were partially offset by lower results in specialty ingredients, due in part to operational startup costs. Source ADM 2017 Annual Report at https://assets.adm.com/Investors/Shareholder-Reports/2017/2017-Annual-Report_032917.pdf
In Frutarom's 2017 annual presentation they provide a chart that estimates Kerry's flavor sales at about U.S. $1,200 million and the Wild flavors portion of ADM at about $550 million.
---------------------------------------------------------------------------------------------------------------------------
For 2016, we estimated that the total market grew about 1.5% in US $ from 2015. The slow USD growth in 2015 and 2016 was primarily due to the significant exchange rate drop of the euro since 2014, as well as a tentative worldwide consumer economy.
In Symrise's Year 2016 financials, released March 14, 2017 they separated out the "Flavor" from the "Flavor & Nutrition" as reported for fiscal years 2015 & 2016. This reduced our previously reported 2015 F&F only sales figure for Symrise by 547.8 million euros reported for the "Nutrition" segment. In 2016, Nutrition accounted for 576.0 million euros. Similarly, for 2016 "Nutrition" is removed from the F&F sales of Symrise.
For 2016, Symrise estimated the traditional market for flavorings and fragrances (F & F market), at � 22.3 billion (~= U.S $24.7 Billion) in 2016, according to calculations made by the IAL Consultants market research institute. This did not include aroma chemicals and cosmetic ingredients, which, according to the current reports from TechNavio/Infiniti (December 2016 issue) and Global Industry Analysts (GIA; 2015 edition), achieved sales of approximately � 5.2 billion (= ~ U.S. $5.75 billion) globally. In this � 27.5 billion total market that they compete Symrise estimated the market shares as Givaudan (16%), Firmenich (11%), IFF (11%), Symrise (11%) and all others (50%). As noted earlier, this included 576.0 million euros for the Symrise "Nutrition" segment (which are removed from our F&F numbers for consistency).
In 2016 Frutarom continued to have accelerated growth as it continued to acquire various companies. Total Sales for Frutarom were $1147.0 million of which the Flavors segment reached about 74% of sales while Specialty Fine Ingredients sales were about 20% of sales. As these two "core activity" segments are considered here as the F&F portion of the business, we report the adjusted Frutarom F&F sales for 2016 as U.S. $1,067.5 million.
It should be noted that for 2016, both Kerry Ingredients & Flavors and the Wild flavors portion of ADM should possibly be in the Top Ten. However, the inclusion of so many other non-flavor ingredients in their sales numbers makes it impossible to truly estimate the F&F portion of sales. In Frutarom's 2016 annual report they provide a chart that estimates Kerry's flavor sales at about U.S. $1,250 million and the Wild flavors portion of ADM at about $550 million.
---------------------------------------------------------------------------------------------------------------------------
For 2015, Symrise estimated the total F&F market at approximately 22.3 billion euros = ~ U.S. $24.7 billion. They estimated Market shares as: Givaudan (18%), Firmenich (12%), Symrise (12%) and IFF (12%). We presume for Symrise, that without including the "Nutrition" portion of sales, their market share would be lower.
---------------------------------------------------------------------------------------------------------------------------
For 2014, Symrise estimated the total F&F market at approximately 20.5 billion euros = ~ U.S. $27.5 billion. They estimated Market shares as: Givaudan (18%), Firmenich (12%), Symrise (12%) and IFF (11%). For 2013, Symrise estimated the total F&F market at approximately 17.4 billion euros = ~ U.S. $24 billion. They estimated Market shares as: Givaudan (20%), Firmenich (14%), IFF (13%) and Symrise (11%).
In 2014, ADM acquired Wild Flavors and began integrating it with other divisions in ADM including specialty proteins (including isolated soy proteins, textured vegetable protein, soy protein concentrates, and soy flour & grits), emulsifiers, edible beans, natural health and nutrition (natural-source vitamin E, plant sterols, soy isoflavones and Omega-3 DHA), soluble fiber, polyols, hydrocolloids and other specialty ingredients. The integrated group reports sales in 2015 of $2,047 million compared to $1,368 million in 2014. A significant part of the sales increase (possibly $600+ million?) was due to non-flavor ingredients sales, and the Flavor sales portion is not reported.. Therefor, like Kerry, it is impossile to accurately estimate the flavor sales (for lack of reporting detail).
For 2014 we estimated that Wild flavors grew at a rate of 4.4% to 934 € = ~$1241 million (although ADM in several mid-2014 press releases stated that the Wild sales revenue would be about 1 billion euros for 2014).
It should be noted that Kerry Ingredients & Flavors should be in the Top Ten. However, the inclusion of so many other non-flavor ingredients in their sales numbers makes it impossible to truly estimate the F&F portion of sales. In March 2015, Frutarom estimated Kerry's flavor sales to be a little greater than US $900 million - see Frutarom Company Presentation March 2015.
---------------------------------------------------------------------------------------------------------------------------
*In 2013 we began including Huabao International in our tabulalations. Our reported 2013-2014 sales is only for flavors & fragrance segments and excludes 1,069,831 Hong Kong dollars = $137,971.2 million in other sales. Similarly, for 2014-2015 sales of F&F sectors (only) was 3,380.9 million HKD (slightly higher than our earlier estimate of 3,310 million HKD).
Although not appearing in our tabulation, Ogawa reported 2015 sales of 23,679 million yen = US $195.7 million (year ending December 2015) and 24,335 million yen = US $224.3 million (year ending December 2016).
Sales results for 1999 to 2002 are available HERE and for 2002 to 2006 click HERE. This tables include Quest International in the Top 10 for years 1999-2006. For 2007 to 2011 click HERE. For 2009-2013 click HERE. Please note that the exchange rates for all these earlier year tables were based on December 31 rates and thus vary somewhat from the Current 2012-2016 table or the 2011-2015 table found HERE.
(1) Market Share is based on U.S. dollar
values
(3) Accounting Period of July 1 to June
30
(4) Accounting Period of April 1 to March
31
(5)Accounting Period of Oct. 1 to Sept, 30; Net
sales given are Company consolidated sales, See T.Hasegawa
Co., Ltd.
(6) Accounting Period of Sept. 1 to August 31
until year 2000. In year 2000, Universal Foods changed is name to
SENSIENT TECHNOLOGIES CORPORATION and the Flavor division is now
known as Sensient Flavors. In addition, the accounting period was
changed to January 1 - December 31 starting in year 2000 and in the
"funny" way of making one look larger than they really are in
F&F, Sensient's Flavor sales from 2000-2012 included "Dehydrated
Products" (onion/garlic/chilies/dehydrated vegetables) which are
not flavors or fragrances in the conventional sense. In our
figures for Sensient, we have removed sales for the "Dehydrated
Products" (now referred to as "Natural Ingredients") for
2000-2013.
(7) ** See also Note (6). F&F figures in
the tables for 2000-2013 for Sensient Flavors &Fragrances
are estimates as we
have removed reported sales of "Dehydrated products" . In 2006,
dehydrated products were 27% of the reported F&F sales, in 2007
& 2008 also about 27% of sales. In 2009 & 2010 we estimate
that dehydrated products were about 29% and 28% of sales,
respectively. In 2011, 28% of F&F sales were dehydrated products.
In 2012, 29% of F&F sales were dehydrated products. For 2013, 27%
of sales were "Dehydrated Products" (now referred to as
"Natural Ingredients"); but in 2014, Sensient restated sales of
"Traditional Flavors & Fragrances" and "Natural Ingredients" as
separate categories for 2012, 2013 and 2014 - and comparison of our
previously reported figures indicates that some of the so-called
dehydrated products possibly should have beed included in our sales.
Although Sensient's breakout has always been somewhat obscur, we
presume that they are now reporting in a manner more consistent with
the industry. Our table has used their restated numbers for 2012
& 2013.
Note - for companies with accounting periods that
overlap calendar years, sales are stated for the year in which the
majority of sales periods occur. For example, if Takasago's year end
is March 31, 2014 we treat that as year 2013 sales. Similarly, if
Firmenich's year end is June 30, 2015 we report the year ending as
2014 sales. While not exact, we feel that this treatment still
provides an accurate overall basis for comparison. Similarly, as
noted, currency calculations are based on average calendar year
exchange rates for comparison consistency.
Note - Top 11 Total for market share does not neccessarily
add due to rounding for individual companies.
Note - all foreign currency calculations for the
table are based on FOREX
Yearly Average Rates for the year
indicated
----------------------------------------------------------------------------------------------------
Huabao Intl. Full Year 2016-2017 Sales - June 29, 2017 - Huabao International total sales for the year ending March 31, 2017 was 3,200.4 million RMB (+8.8%) of which ~72% was from the flavors & fragrance related segments. The F&F related segment sales were 2,504.2 million RMB = ~U.S. 377.1 million. Huabao slightly restated the F&F sales for 2015-2016 were restated downword somewhat from the prior year. In October 2016, Huabao decided to use the Chinese RMB as the reporting curency hence forth.
Frutarom Full Year 2016 Sales - Haifa, Israel – March 23, 2017 - Frutarom's 2016 sales rose 31.4% to a record US$ 1,147 million of which US$ 1,067.5 million are considered F&F related.
Mane - Full Year 2016 Sales increase - March 14, 2017 - Mane achieved sales of � 1,058 million (+11.7%) in 2016 vs � 947.6 million in 2015, which translateS to USD $1,172 million for the year 2016 (at an average exchange rate of 1 Euro = 1.1073 U.S. $). Sales growth was +14.4% in local currencies.
Symrise reports strong sales and earnings growth in 2016 - March 14, 2017 - Symrise benefited from robust demand across all regions and segments in 2016. Sales increased by 12 % year-on-year in reporting currency to � 2,903.2 million (2015: � 2,601.7 million). In local currencies. Excluding Diana,combined F&F sales from the Flavor segment and Scent & Care were 2,089.6 million euros.
Robertet Full Year 2016 Sales - February 24, 2017 - Consolidated revenue for the year ended 31 December 2016 was � 468 million, an increase of 7.6% compared to 2015.
IFF Full Year 2016 Sales - February 15, 2017 - IFF's full year net sales for 2016 were $3,116.4 million an increase of 3.1% over 2015.
Sensient F&F Full Year 2016 Sales - Milwaukee, Feb. 09, 2017 - For the full year 2016, the Sensient Flavors & Fragrances Group reported revenue of $795.3 million, a decrease of approximately 3% from the $819.0 million reported in 2015.
T. Hasegawa Full Year 2015-2016 Sales Results - November 16, 2016 - for the 12 months ending September 30, 2016, T. Hasegawa's consolidated net sales were up 0.8% to ¥ 47,591 million compared to ¥ 47,228 million in the prior year. Net income for the period was up 19.5% to ¥ 3,637 million.
----------------------------------------------------------------------------------------------------
Firmenich Full Year 2015-2016 Sales - Geneva, Switzerland, October 5th, 2016 – Firmenich posted solid results in its Fiscal Year 2016, which ended June 30th 2016. The Group achieved CHF 3.2 billion in net sales, growing +8.2% in local currency and +6.3% in Swiss Francs.
Huabao Intl. Full Year 2015-2016 Sales - June 22, 2016 - Huabao International total sales for the year ending March 31, 2016 was 3,928.2 million Hong Kong dollars (-9.2%) of which ~80.3% was from the flavors & fragrance related segments. The F&F related segment sales decreased ~4.2% to 3,155.2 million HKD = ~U.S. 407.0 million. Huabao slightly restated the F&F sales segments for 2014-2015 to reflect the inclusion of the sale of aroma raw materials products. Please note that in the Current year tabulation that sales were restated downword somewhate from the prior year.
Takasago Full Year 2015-2016 Sales - May 13, 2015 - Takasago sales increased 7.6% to ¥ 141,660 million from ¥ 131,653 in the prior year ending March 31. Net income increased 91.4% to ¥ 4,880 million from ¥ 2,549 million.
Frutarom Full Year 2015 Sales - Haifa, Israel – March 17, 2016 - Frutarom's sales in 2015 as reported in US dollars grew 6.5% to reach a record US$ 872.8 million, reflecting constant-currency growth over the previous year of 4.9% on a pro-forma basis. Sales for the Flavors activity in 2015 as reported in US dollars rose 3.0% to reach a record US$ 607.5 million compared with US$ 589.8 million the previous year, reflecting constant-currency growth on a pro-forma basis of 5.3% from the parallel period. Currency effects reduced sales on a pro-forma basis by 14.3%. Sales for the Specialty Fine Ingredients activity in 2015 as reported in US dollars rose 16.8% to reach US$ 184.9 million compared with US$ 158.4 million the previous year, reflecting constant-currency growth on a pro-forma basis of 1.5% from the parallel period. Currency effects reduced sales on a pro-forma basis by 6.0%. Reported net income for 2015 rose 9.7% and reached a record US$ 96.1 million.
Symrise Full Year 2015 Sales - March 8, 2016 - Symrise 2015 sales increased to � 2,601.7 million (2014: � 2,120.1 million). This represents growth of 23 % in reporting currency and 18 % at local currency. The Diana Group, which was acquired in mid-2014 and is now fully integrated, contributed sales of � 524.8 million (2014: � 233.9 million). Excluding the contribution of Diana, Symrise also generated strong sales growth with 10 % in reporting currency and 6 % at local currency. Symrise increased its net income in the year under review by 17 % to � 246.8 million (2014 normalized: � 211.6 million). The Scent & Care segment achieved sales of � 1,073.7 million in 2015 (2014: � 980.4 million). This represents an increase of 10 % (4 % at local currency). All business divisions contributed to growth, in particular Aroma Molecules and Cosmetic Ingredients. Symrise benefited above all from strong demand for menthol and cosmetic active ingredients. Flavor & Nutrition experienced a substantial 34 % increase in sales (31 % at local currency) and benefited in particular from strong demand for beverages and savory applications. Diana Group also achieved strong growth, especially with pet food and aquaculture applications. Excluding Diana, sales increased by 11 % (8 % at local currency). In January 2016 Symrise expanded its fragrance activities with the acquisition of US-based Pinova Holdings, Inc. (including Renessenz). This has given the company access to additional natural ingredients which are used in perfume compositions. Moreover, Symrise has expanded its forward integration in menthol to include cooling substances for oral care.
Robertet Full Year 2015 Sales - March 7, 2016 - Robertet has reported that its net consolidated sales in 2015 totaled EUR 435 million, up 11.6% compared to 2014. At constant rates and structure, turnover was up 7.5%. Turnover achieved was 85% abroad and all geographies are growing. Europe posted strong growth thanks to the good performance of the Commodities Division and Latin America thanks to the recovery of Brazil. The unaudited consolidated net profit should be around 36 million euros, an increase of 22%, higher than expected. Final results will be published no later than 30 April 2016.
Mane - Full Year 2015 Sales increase - March 1, 2016 - Mane achieved sales of � 947.6 million (+23.1%) vs � 769 million in 2014 (personal communication). Sales growth was +15.0% in local currencies.
Givaudan Full Year 2015 Sales - Geneva, 2 February 2016 - Givaudan Group full year sales were CHF 4,396 million, an increase of 2.7% on a like-for-like basis and a decline of 0.2% in Swiss francs when compared to 2014. Fragrance Division sales were CHF 2,096 million, an increase of 1.9% on a like-for-like basis and a decline of 0.6% in Swiss francs. Flavour Division sales were CHF 2,300 million, an increase of 3.5% on a like-for-like basis and 0.2% in Swiss francs. Net income increased to CHF 635 million in 2015 from CHF 563 million in 2014, an increase of 12.7%. This results in a net profit margin of 14.4%, versus 12.8% in 2014.
Sensient F&F Full Year 2015 Sales - Milwaukee, Feb. 04, 2016 - The Flavors & Fragrances Group reported revenue of $819.0 million for the year ended December 31, 2015, a decrease of 3.8% from $851.5 million reported in 2014. Operating income increased approximately 1%, to $121.9 million in 2015, from $120.9 million in 2014. The Flavors & Fragrances Group reported fourth quarter revenue of $201.0 million, a decrease of 1% from $203.1 million reported in last year’s fourth quarter. Operating income increased 6.3% to $27.5 million compared to $25.9 million in the fourth quarter of 2014. The above figures includes items not normally considered Flavors & Fragrances - mainly natural ingredients such as dehydrated vegetables. Excluding these items, sales of traditional Flavors & Fragrances in 2015 were $667.9 million vs $715.8 million in 2014 as restated (-6.7%).
IFF Full Year 2015 Sales - February 10, 2016 - IFF's net sales for 2015 were $3,023.2 million, a decline of 2.1%. Adjusted Currency Neutral Sales increased 5%. Net income for the year declined 0.7% to $411.7 million. 4th Qtr sales declined 5.3% to $715.6 million. Full year Flavor sales declined 1% to $1,443 million. Full year Fragrance sales declined 3.1% to $1,580.2 million.
T. Hasegawa Full Year 2014-2015 Sales Results - November 11, 2015 - for the 12 months ending September 30, 2015, T. Hasegawa's consolidated net sales were up 5.1% to ¥ 47,228 million compared to ¥ 44,917 in the prior year. Net income for the period declined 6.0% to ¥ 3,043 million.
----------------------------------------------------------------------------------------------------
Firmenich 2014-2015 Sales - Oct. 7, 2015 - For the financial year ended June 30, 2015, Firmenich posted sales of ~CHF 3,008 million, an increase of 1.9% in Swiss francs and 3% in local currencies. For the first time this year, Firmenich issued an integrated report, sharing both its Business and Sustainability Performance, as they go hand in hand, at the core of the Group’s vision and strategy.
Huabao Intl. Full Year 2014-2015 Sales - June 23, 2015 - Huabao International total sales for the year ending March 31, 2015 was 4,326.5 million Hong Kong dollars (+2.1%) of which ~78.1% was from the flavors & fragrance related segments. The F&F segments sales increase was +6.7% to 3,380.9 million HKD = ~U.S. 436 million.
Takasago Full Year 2014-2015 Sales - May 14, 2015 - Takasago sales increased 0.5% to ¥ 131,653 million from ¥ 131,036 in the prior year ending March 31. Net income decreased 15.7% to ¥ 2,549 million from ¥ 3,025 milllion.
Frutarom Full Year 2014 Sales - Haifa, Israel – March 16, 2015 - Frutarom sales for the full year 2014 increased 21.6% to U.S. $819.5 million. Net income for the year increased 37.7% to $87.6 million. Flavors and Specialty Fine Ingredients sales grew to $741.0 million (+16.9%).
Symrise Full Year 2014 Sales - Holzminden, Germany - March 10, 2015 - In the fiscal year 2014, Symrise AG exceeded its targets and substantially expanded its market position. Group sales increased 15.8% to � 2120.1 million from � 1830.4 million in 2013. In local currencies, sales increased 18.3%. 4th Qtr performance was particularly strong, with an increase in Group sales to � 590.1 million vs. 2013 at � 429.2 million (+37.5%). Net income normalized for one-time effects was up 23 % to � 211.6 million. Full year Scent & Care sales were � 980.4 million vs. � 960.4 million in 2013 (+2.1%). Full year Flavor & Nutrition sales increased 31% to � 1139.7 million vs. � 869.9 million in 2013. This includes � 233.9 million contributed from the Diana Group acquisition since July 2014.
Robertet Full Year 2014 Sales - 3 March 2013 - Robertet has reported 12 month revenues of 390,055 euros (+0.2% from 2013).
IFF Full Year 2014 Sales - New York - February 12, 2015 - Reported net sales for the 2014 full year were $3,088.5 million, up +4.6% from 2013. For the full year, Flavor sales were up +2.4% to $1,457.1 million, while Fragrance sales increased to $1,631.5 million (+6.6%). In the 4th Qtr., IFF net sales increased +4.3% to $756.1 million vs 2013. 4th Qtr. Flavor sales were $356.3 million (+3.9%) while Fragrance sales were $399.8 million (+4.6%). IFF's 2014 net income was $414.5 million, +17.3% from 2013.
Sensient F&F Full Year 2014 Sales - Milwaukee, Feb. 5, 2015 - Sensient's Flavors & Fragrances Group reported full year revenue of $847.0 million and $876.5 million in 2014 and 2013, respectively (-3.4%). Operating income was $119.1 million for the year compared to $120.3 million last year. Foreign currency translation reduced both revenue and operating income by approximately one percent in 2014. In local currency, revenue was off about 1%, and operating income was comparable to 2013. 4th quarter revenue was $201.9 million compared to the $209.0 million in 2013 (-3.4%).
Mane - Full Year 2014 Sales increase - February 4, 2015 - Mane achieved sales of � 769 million in 2014, up 6.4% from � 723 million in 2013. Using the 2014 yearly average EUR/USD Forex exchange rate, 2014 sales in USD were $ 1,022 million (personal communication).
Givaudan Full Year 2014 Sales - Geneva, 29 January 2015 – For the full year 2014 Givaudan recorded sales of CHF 4,404 million, an increase of 3.7% on a like-for-like basis and 0.8% in Swiss francs when compared to 2013. Net income was CHF 563 million, up 14.9% year on year. Developing markets grew 7.0%, and mature markets grew 1.1%, both on a like-for-like basis. Fragrance Division sales were CHF 2,108 million, an increase of 3.6% on a like-for-like basis and 1.2% in Swiss francs. Flavour Division sales were CHF 2,296 million, an increase of 3.7% on a like-for-like basis and 0.4% in Swiss francs.
----------------------------------------------------------------------------------------------------
Firmenich 2013-2014 Sales - Oct. 9, 2014 - For the financial year ended June 30, 2014, Firmenich posted sales of CHF 2,952 million, an increase of 2.1% in Swiss francs and 7% in local currencies. Perfumery posted robust sales growth in local currencies as the Body and Home Care segment grew across all key categories and Fine Fragrance delivered steady progression. For the second consecutive year, Flavors recorded solid sales growth, driven by strong performances in Sweet Goods and Savory and modest growth in Beverages. Ingredients sales were in positive territory this year in a context of continued market commoditization.
Takasago Full Year 2013-2014 Sales - May 14, 2014 - Takasago sales increased 10.1% to ¥ 131,036 million from ¥ 118,973 in the prior year ending March 31. Net income decreased to ¥ 3,025 million from ¥ 4673 milllion.
Frutarom Full Year 2013 Sales - Haifa, Israel – March 19, 2014 - Frutarom's revenues Grew by 9% to US $674 Million; EBITDA increased by 15.5% to US $116 Million; Net profit rose 22% to US $64 Million. 4th Qtr. revenues for 2013 rose to US $192 million reflecting 6.2% organic growth. Frutarom revenues would have reached US$ 784 million and net profit would have been $70 million, if the four acquisitions made in 2013 had been consolidated as of Jan-1-2013.
Symrise Full Year 2013 Sales - Holzminden, Germany - March 13, 2014 - Symrise 2013 sales increased 5.5% to � 1,830.4 million (+10% in local currencies). Group net income increased 9.4% to � 172.3 million. Scent & Care 2013 sales increased 8.7% to � 960 million (+13% in local currencies). Flavor & Nutrition 2013 sales increased 2.1% to � 870 million (+7% in local currencies).
Robertet Full Year 2013 Sales - 24 February 2014 - Robertet has reported sales for 2013 of 389.489 million euros vs. 395.601 million euros in 2012 (-1.54%) . At constant exchange rates, sales were +1%.. The unaudited consolidated earnings were in line with expectations and amounted to slightly more than EUR 25 million, down about 8%. Final results will be published no later than 30 April 2014.
Mane - Full Year 2013 Sales increase - February 19, 2014 - Mane achieved consolidated sales of � 723.2 million in 2013, up 13.3% from � 638.4 million in 2012 (personal communication).
IFF Full Year & 4th Qtr 2013 Sales - New York - Feb. 13, 2014 - Revenue for the full year increased 4.7% to $2,952.9 million. Local currency sales increased 5% for the full year. On a like-for-like basis (LFL), which excludes the exit of Flavors low-margin sales activities, local currency sales increased 6%. The emerging markets grew by 10% and accounted for 49% of full year sales. Full year Fragrance sales increased 6% to $1,530.2 million while Flavor sales increased 3.2% to $1,422.7 million. Fourth Qtr Sales increased 6.6 % to $725,169 million. Fourth Qtr Fragrance sales increased 7.9% to $382,216 million while Fourth Qtr Flavor sales increased 5.1% to $342,953 million. For the Full Year, net income increased 39.1% to $353,544 million.
Sensient F&F Full Year 2013 Sales - Milwaukee, Feb. 10, 2014 - The Flavors & Fragrances Group reported full year revenue of $881.3 million in 2013, up from $875.3 million last year. Operating income was $122.4 million in 2013 and $123.0 million in 2012. The Flavors & Fragrances Group’s operating margins were 13.9% in 2013 and 14.1% in 2012. The Flavors & Fragrances Group reported 4th quarter revenue of $210.1 million compared to the $216.9 million reported in the comparable period last year. Operating income increased 2% to $29.2 million, compared to $28.7 million in last year’s fourth quarter. Sensient includes "dehydrated vegetables" in thier Flavors & Fragrances sales numbers. In 2013 this was 27% of sales. Accordingly, 2013 sales for conventional Flavors & Fragrances were ~$643.3 million.
Givaudan Full Year 2013 Sales - Geneva, 30 January 2014 – Givaudan Group full year sales were CHF 4,369 million, an increase of 5.5% on a like-for-like basis and 2.6% in Swiss francs vs. 2012. Fragrance Division sales were CHF 2,083 million, an increase of 5.1% on a like-for-like basis and 3.0% in Swiss francs. Flavour Division sales were CHF 2,286 million, an increase of 5.8% on a like-for-like basis and 2.3% in Swiss francs. Gross margin increased to 44.7% from 42.4%. Net income increased to CHF 490 million in 2013 from CHF 410 million in 2012, an increase of 19.5%.
T. Hasegawa Full Year 2012-2013 Sales Results - November 8, 2013 - for the 12 months ending September 30, 2013 T. Hasegawa's consolidated net sales were up 1.6% to ¥ 45,104 million compared to ¥ 44,386 in the prior year. Net income for the period increased 36.0% to ¥ 3,518 million.
----------------------------------------------------------------------------------------------------
Firmenich 2012-2013 Sales - Oct. 10, 2013 - For the financial year ended June 30, 2013, Firmenich posted sales of CHF 2,890 million, an increase of 9.6%. Perfumery posted single-digit sales growth in local currencies. Flavors recorded high single-digit sales growth while Ingredients sales were down slightly in the fiscal year. (In our charts, 2012-2013 sales are reported as 2012 sales).
Frutarom Full Year 2012 Sales - Haifa, Israel – March 13, 2013 - Frutarom's revenues in FY 2012 totaled US$ 618 million, a 19.2% increase over 2011. Net profit increased 24% to US$ 52 million.
Symrise Full Year 2012 Sales - Holzminden, Germany - March 12, 2013 - In 2012 Symrise reported sales of €1,734.9 million (+9.6%) or +6 % in local currencies, while Net Income increased 7.5% to €157.5 million. Scent & Care reported sales of €883 million (+10%) or +7.0% in local currencies. Flavor & Nutrition saw sales increase by +12 % to €852 million (or +6% in local currencies).
Robertet Full Year 2012 Sales - 20 February 2013 - Robertet has reported sales for 2012 of 395.601 million euros, an increase of 6% over 2011. Fragrance sales increased 3.57% to 141.052 million euros. Flavour sales increased 8.85% to 154.89 million euros and Ingredient sales increased 4.97% to 96.648 million euros.
Mane - 2012 Sales increase of 20% - February 15, 2015 - Mane achieved a consolidated turnover of € 638.4 million in 2012, up 20.4% from € 530.1 million in 2011 (personal communication). Mane's 5 Year average annual sales growth has been above 15% - significantly higher than any other major F&F company.
Takasago 9 Month 2012-2013 Sales - February 14, 2013 - 9 Month sales increased 3% to ¥ 90,470 million from the prior fiscal year while net income increased 57% to ¥ 4,053 million.
IFF Full Year 2012 Sales - New York, Feb. 8, 2013 - revenue for the full year increased 1.1% to $2,821.4 million. Local currency sales increased 4% for the full year, reflecting accelerated momentum throughout the year. On a like-for-like basis, sales increased 5%. The emerging markets accounted for 47% of full year sales. Net income for the full year totaled $254.1 million, compared with net income of $266.9 million in the prior year. The Fragrance business unit revenue for the full year of $1,443.1 million was flat compared with the prior year. Fragrance local currency sales increased 3%. Flavors business unit revenue for the full year increased 2.3% to $1,378.4 million. For the 4th Qtr, total revenue increases 5.6% to $680.6 million. 4th Qtr Fragrance revenue increase 10.1% to $354.1 million and 4th Qtr Flavors revenue increased 1.1% to $326.4 million.
Sensient F&F Full Year 2012 Sales - Milwaukee, Feb. 8, 2013 - The Flavors & Fragrances Group reported record revenue of $875.3 million in 2012 (including dehydrated products), up 2.1% from $857.5 million in 2011. Operating income was $123.0 million in 2012 compared to $129.4 million in 2011. Foreign currency translation reduced revenue by approximately three percent and operating income by one percent in 2012. In the 4th Qtr, the Flavors & Fragrances Group reported revenue of $216.9 million, an increase of 5.6% over the $205.4 million reported in last year’s fourth quarter. Operating income was $28.7 million in the quarter compared to $31.8 million in the fourth quarter of 2011.
Givaudan Full Year 2012 Sales - Geneva, 5 February 2013 - For the full year, Givaudan Group sales totalled CHF 4,257 million, an increase of 6.6% in local currencies and 8.7% in Swiss francs compared to 2011. Sales of the Fragrance Division were CHF 2,021 million, an increase of 8.4% in local currencies and 10.3% in Swiss francs. Sales of the Flavour Division were CHF 2,236 million, an increase of 5.0% in local currencies and 7.4% in Swiss francs compared to 2011. Net income increased to CHF 411 million in 2012 from CHF 252 million in 2011, driven by an improved operating performance, lower financial expenses and a lower income tax rate. This represents 9.7% of sales in 2012, versus 6.4% in 2011. Basic earnings per share increased to CHF 45.15 in 2012 from CHF 27.71 in the previous year.
T. Hasegawa 2011-2012 Sales Results - for the full year ending September 30, 2012 consolidated net sales were ¥44,386 million compared to ¥ 44,246 in the prior year. Net income for the period decreased 17% to ¥2,586 million.
----------------------------------------------------------------------------------------------------
In 2011, based on comparison of major currency rates (on Dec. 31), the U$ $ had a increase of 0.48% against the Swiss Franc, a decrease of 5.18% against the Japanese Yen, a decrease of 4.72% against the Chinese Yuan and a increase of 15.76% against the Indian Rupee. The dollar gained 3.3% against the Euro and 0.55% vs the British pound. However, comparing single points in time can be somewhat misleading as during the year major currency swings occurred, particulary in the EU countries due to the continuing economic instability. For a few major companies (e.g, Mane, IFF, Sensient, Frutarom) 2011 was remarkably successful with some of the largest year-to-year gains in recent years. Overall we estimate that the total market was essentially flat with a marginal decline in US $ from 2010.
Takasago Full Year 2011-2012 Sales - May 14, 2012 - Takasago sales for the Fiscal Year Ended March 31,2012 were ¥113,676 million compared to ¥114,861 million in the prior fiscal year (-1.0%).
Symrise Full Year 2011 Sales - Holzminden, Germany - March 14, 2012 - In 2011 Symrise reported sales of €1,583.6 million (+0.7%) or +2 % in local currencies. Scent & Care reported sales of €801.4 million (-0.4%) or +1.0% in local currencies. Flavor & Nutrition saw sales increase by +1.9 % to €782.2 million (or +3.1% in local currencies).
Frutarom Full Year 2011 Sales - Haifa, Israel – March 14, 2012 - Frutarom's revenues in FY 2012 totaled US$ 518.4 million, a 14.9% increase in comparison to revenues of US$ 451.1 million in 2010.
Mane - 2011 Sales increase of 14.8% - February 16, 2012 - Mane achieved a consolidated turnover of USD 738 million in 2011, up 14.8% from USD 643 million in 2010 (personal communication).
Givaudan Full Year 2011 Sales - Geneva, 16 February 2012 – In 2011, Givaudan Group sales totalled CHF 3,915 million, an increase of 5.2% in local currencies and a decline of 7.6% in Swiss francs compared to 2010. Sales of the Fragrance Division were CHF 1,833 million, an increase of 4.7% in local currencies and a decline of 7.8% in Swiss francs. Sales of the Flavour Division were CHF 2,082 million, an increase of 5.7% in local currencies and a decline of 7.5% in Swiss francs compared to 2010.
IFF 4th Qtr & Full Year 2011 Sales - Feb. 9, 2012 - IFF full year 2011 sales were $2,788.0 million, a 6.3% increase over 2010. 4th Qtr. sales were $644,383 million (+2.3%). Net income for the full year increased 1.3% to $266.9 million. Operating profit decreased $25 million year-over-year to $28 million including an expense of $35 million associated with the patent litigation settlement and restructuring costs in the fourth quarter 2011. Excluding these items, operating profit increased 18 percent, or $10 million, to $63 million. Fragrance sales for the full year were $1,440.7 million (+1.5%) while 4th Qtr sales were $321.6 million (-3.0%). Flavor sales for the full year were $1,347.3 million (+12%) while 4th Qtr sales were $322.7 million (+8.2%).
Sensient F&F 2011 Sales - Milwaukee, Jan 7, 2012 - Revenue for the Flavors & Fragrances Group increased 6.4% to a record $860.7 million in 2011, compared to $809.1 million reported in 2010. Operating income for the year was $130.8 million, an increase of 7.3% over the $122.0 million reported last year. Foreign currency translation increased revenue and operating income by approximately 2% in 2011. The Flavors & Fragrances Group reported fourth quarter revenue of $206.3 million compared to the $206.1 million in the same quarter last year. Operating income for the quarter was $32.2 million, a 9.3% increase over the $29.4 million reported in the comparable period of 2010. However, as these figures include dehydrated products such as dehydrated vegetables that are about 28% of sales, we estimate that the sales of conventional flavors & fragrances in 2011 were about $619.7 million.
Robertet Full Year 2011 Sales - 20 January 2012 - Robertet has reported sales for 2011 of 373.282 million euros, an increase of 3.05% over 2010. Fragrance sales increased 4.26% to 136.194 million euros. Flavour sales declined 0.87% to 142.291 million euros and Ingredient sales increased 7.27% to 92.075 million euros.
T. Hasegawa 2010-2011 Sales Results - for the full year ending September 30, 2011 consolidated net sales were ¥44,246 million (-2.0% from 2010). Net income increased 9.7% to ¥3,115 million
----------------------------------------------------------------------------------------------------
In 2010, based on comparison of major currency rates (on Dec. 31), the U$ $ had a decline of 10.8% against the Swiss Franc, a decrease of 14.8% against the Japanese Yen, a decrease of 3.6% against the Chinese Yuan and a decrease of 3.8% angainst the Indian Rupee. Conversely the dollar gained 6.8% against the Euro and 3.5% vs the British pound. However, comparing single points in time can be somewhat misleading as during the year major currency swings occurred, particulary in the EU countries due to economic instability. For most major companies, 2010 was remarkably successful with some of the largest year-to-year gains in recent years. We estimate that the total market grew ~9-10% in US $ from 2009. This growth was mainly fueled by emerging markets such as China, India and Brazil. For the numerous small flavor & fragrance companies in 2010, which continue to lose market share, we estimate an overall sales decline in US $ of about 2%.
Firmenich 2010-2011 Sales - Oct. 12, 2011 - For the financial year ended June 30, 2011, Firmenich posted sales of CHF 2,781.6 million, a decline of 3.9% in Swiss Francs but an increase of 5.8% in local currencies. Perfumery posted robust single-digit sales increases in local currencies. Flavor sales posted high single-digit local currency growth with increases across all segments. Ingredients sales posted a healthy single-digit sales increase in local currencies.
Frutarom Full Year 2010 Sales - Haifa, Israel – March 24, 2011 - Frutarom's revenues in FY 2010 totaled US$ 451.1 million, an 8% increase in comparison to revenues of US$ 425.2 million in 2009 in local currency terms. The strengthening of the US dollar against European currencies offset 1.9% of the increase in Frutarom's sales. In terms of US dollars, the sales increased by 6.1% compared to 2009.
Symrise Full Year 2010 Sales - Holzminden, March 9, 2011 - Symrise increased sales in 2010 by 15.4 % to € 1.571.9 million (+11% in local currency) and exceeded its target to achieve sales growth of at least 8 %. Scent & Care sales increased 17.9% to € 804.5 million while Flavor & Nutrition sales increased 12.9% to € 804.5 million.
Mane - 2010 Sales increase of 27.6% - February 15, 2011 - Mane achieved a consolidated turnover of 480.1 million euros in 2010, up 26.7% from 376.2 million euros in 2009 (personal communication).
IFF 4th Qtr & Full Year 2010 Sales - Feb. 10, 2011 - IFF full year 2010 sales were $2,622.9 million, an increase of ~13% in reported sales as well as local currencies. For the 4th Qtr 2010, sales were $629.9 million, an increase of 7.6%. Fragrance sales for the full year were $1,419.6 million (+14.0%) while 4th Qtr sales were $331.6 million (+5.1%). Flavor sales for the full year were $1,203.3 million (+11.3%) while 4th Qtr sales were $298.2 million (+10.4%). Net income for the full year increased 34.8% to $263.6 million.
Givaudan Full Year 2010 Sales - Geneva, 8 February 2011 – In 2010, Givaudan Group sales totalled CHF 4,239 million, an increase of 8.9% in local currencies and 7.1% in Swiss francs compared to the previous year. Sales of the Fragrance Division were CHF 1,988 million, an increase of 10.5% in local currencies and 9.0% in Swiss francs. Sales of the Flavour Division were CHF 2,251 million, an increase of 7.5% in local currencies and 5.4% in Swiss francs compared to the previous year.
Sensient F&F 2010 Sales - Milwaukee, Feb 04, 2011 - The Flavors & Fragrances Group reported full year 2010 sales of $809.1 million, an increase of 4.7% vs. 2009. Operating income for the same period declined 2.0%. For the 4th Qtr, F&F sales were $206.1 million, up 5.2% while operating income declined 0.5%. As these figures include dehydrated products such as dehydrated vegetables that are about 28% of sales, we estimate that the sales of conventional flavors & fragrances in 2010 were about $582.6 million.
Robertet Full Year 2010 Sales - 17 January 2011 - Robertet has reported sales for 2010 of 362.25 million euros, an increase of 18.7% over 2009. Fragrance sales increased 15.7% to 130.6 million euros. Flavour sales increased 17.3% to 143.5 million euros and Ingredient sales increased 26.1% to 85.8 million euros.
T. Hasegawa 2009-2010 Sales Results - December 13, 2010 - for the full year ending September 30, 2010 consolidated net sales were ¥ 45,167 million, up 4.4%. For the same period, net income increased 58.5% to ¥ 2,840 million.
Takasago Half Year 2010-2011 Sales - November 22, 2010 - Sales for the half fiscal year ending September 30, 2010 were ¥ 60,547 million, up 2.9% from the prior year while net income increased 85.1% to ¥ 3,325 million.
Frutarom 3d Qtr 2010 Sales - Haifa, Israel – November 16, 2010 - Frutarom's revenues in the first 9 months of the year totaled US$ 338.7 M, an increase of ~ 8.2% in local currency terms compared to the first nine months of 2009 which totaled US$ 316.7. In US$ terms, Frutarom's sales increased by ~ 6.9% compared to the first nine months of 2009. Frutarom's revenues in 3d Qtr 2010 totaled US$ 111.0 M, an increase of 4.8% vs 2009. The weakening of the Euro and the Pound Sterling against the US$, which was slightly offset by the strengthening of the Swiss Franc and the NIS against the US$, resulted in a 0.6% decrease in sales in US$ terms compared to 3d Qtr 2009.
----------------------------------------------------------------------------------------------------
Firmenich
2009-2010 Sales - Oct.
13, 2010 - For the financial year ended June 30, 2010, Firmenich
posted record sales of CHF 2873 million, an increase of 12.1% in
local currencies and 8.7% in Swiss Francs, regaining its position as
growth leader in the fragrance and flavor industry. This performance
was driven by double-digit growth in Perfumery and Flavor segments,
with a particularly strong rebound in Fine Fragrance during the
second half of the year. The perfume and flavor ingredients business
followed the trend, recording a healthy high single-digit growth
performance.
Leffingwell estimates that Firmenich increased market
share by about 1.7% in the period.
Takasago Full Year 2009-2010 Sales - May 14, 2010 - Sales for the full fiscal year ending March 31, 2010 were ¥114,347 million, down 7.8% from the prior year.
Frutarom 4th Qtr & Full Year 2009 Sales - Haifa, Israel – March 16, 2010 - Frutarom's full year sales fell 10.2% (in US $) vs. 2008, totaling $425.2 million. 4th Qtr sales increased 9.9% to $108.5 million.
Symrise Full Year 2009 Sales - Holzminden, March 3, 2010 - The company increased sales by 3.2 % at actual rates and by 2.7 % at local currency. The Flavor & Nutrition division increased revenues from € 648.1 million to € 679.7 million in the 2009. The Scent & Care division benefited from an increase in business during the second half of the year. Sales for the division rose by 1.6 % to € 682.3 million (previous year: € 671.8 million).
Givaudan 4th Qtr & Full Year 2009 Sales - Geneva - Feb. 16, 2010 - In 2009, Givaudan group sales totaled CHF 3,959 million, an increase of 1.4% in local currencies and a decrease of 3.1% in Swiss francs compared to 2008. On a comparable basis (in local currencies and excluding the impact of divestments), sales increased by 1.6% versus 2008. The Fragrance Division recorded full year sales of CHF 1,824 million, an increase of 0.9% in local currencies and a decrease of 3.9% in Swiss Francs. After a challenging first quarter, business momentum recovered, improving consistently during the three consecutive quarters. The Division achieved sales growth of 5.3% in local currencies during the 4th Qtr 2009. The Flavour Division reported full year sales of CHF 2,135 million, representing a growth of 1.9 % in local currencies and a decline of 2.5 % in Swiss francs. Excluding the effects of the divested business, sales performance in local currencies increased 2.2%. During the fourth quarter of this year, the Division achieved sales growth of 4.3% in local currencies.
Robertet 2009 Sales - Feb. 15, 2010 - Robertet has announced that its 2009 turnover increased by 0.6% to 305.1 million euro. The company's flavor division (accounting for about 40% of the company's total turnover), reported a 5.3% growth to 122.3 million euro.
Takasago 3 Qtrs 2009-2010 Sales Results - Feb. 12, 2010 - For the 3 Qtrs period, April 1, 2009 - December 31, 2009, sales declined 9.5% to ¥ 87,576,000. The company projects a Consolidated Financial Sales Forecast for the fiscal year (April 1, 2009 - March 31, 2010) of ¥ 117,000,000, a decline year over year of 5.6%.
Mane 2009 Sales increase 13% - February 08, 2010 - Mane achieved a turnover of 376.2 million euros in 2009, up 13.1% from 332.5 million euros in 2008 (personal communication).
Sensient F&F 4th Qtr & Full Year 2009 Sales - February 05, 2010 - The Flavors & Fragrances Group of Sensient reported revenue for the 4th Qtr. of $195.96 million, an increase of 2.3% compared to to the same period in 2008. For the full year, sales declined 3.5% to $772.87 million vs the same 2008 period. As these figures include dehydrated products such as dehydrated vegetables that are about 29% of sales, we estimate that the sales of conventional flavors & fragrances in 2009 were about $548.7 million.
T. Hasegawa 2008-2009 Sales Results - November 13, 2009 - for the full year ending September 30, 2009 consolidated net sales were ¥ 43,244,000, down 4.8%. For the same period, earnings declined 19.9% to ¥ 1,792,000. For the fiscal year ending September 30, 2010 the company projects that consolidated net sales will increase 2.3% to ¥ 44,260,000. In our table, these are listed as "2009" sales.
----------------------------------------------------------------------------------------------------
Firmenich 2008-2009 Sales - Oct. 7, 2009 - For the financial year ended June 30, 2009, Firmenich posted sales of CHF 2,641 million, a decline of 4.3% in local currencies. Consumer products linked to basic needs, like eating, drinking, washing and cleaning, were the most resistant to economic crisis, while discretionary Fine Fragrance suffered most. (It should be noted , in contrast to most other companies who reported full year sales as of December 31, Firmenich reported sales were from July 1, 2008 to June 30, 2009 - the period of the world's worst economic and financial crisis). In our table, these are listed as "2008" sales.
Takasago 2008-2009 Sales - May 14, 2009 - Sales for the full fiscal year ending March 31 were ¥123,973 million, down 0.2% from the prior year - but beating the latest projection of ¥122,000 million issued in February. Flavor sales for the year increased 2.5% while fragrance sales declined 3.4%. Aroma chemical & Fine chemicals (combined) declined 4%.
Frutarom Full Year 2008 Sales - Haifa, Israel – March 19, 2008 - Frutarom reported record sales of US$ 473.3 M for the year 2008 - a growth of 25% compared with 2007, excluding the effect of the strengthening of European currencies and the Shekel against the US dollar. Without excluding the aforementioned effect, sales increased by 28.5%. At the same time, Frutarom achieved an increase of 34.8% in the annual gross profit to US$ 176.3 M, an improvement of gross margin to 37.2% compared to 35.5% last year, a leap of 64% in operating profit which totaled US$ 56.6 M. During the 4th Qtr of 2008, Frutarom's sales totaled US$ 98.7 M, a decrease of 1% compared to the same quarter last year, excluding the effect of the weakening of the European currencies and the Shekel (in which most of Frutarom's sales are made) against the US dollar, at rates of up to 24%. Without excluding the aforementioned effect, sales decreased by 9%. The considerable trend of reducing inventory levels among Frutarom's customers worldwide in the last few months, also affected the decrease in sales during the fourth quarter.
Symrise Full Year 2008 Sales Results - Holzminden, March 4, 2009 - Overall sales for 2008 increased to EUR 1,319.9 million (+6.5% in local currencies and +3.6% in euros). Scent & Care increased to EUR 671.8 million (+3% in local currencies and +0.1% in euros). Flavor & Nutrition increased to EUR 648.1 million (+10.5% in local currencies and +7.4% in euros). For the year, net income dipped -7% in euros and - 2% in local currencies to € 90.4 million. "The sales performance of Scent & Care in fiscal 2008 was mixed. While Life Essentials, Household, Aroma Molecules and Mint performed according to plan, the “luxury segments” Fine Fragrances and Personal Care had to contend with demand problems caused by the global economic situation. In 2008, Scent & Care generated sales of € 671.8 million. As a result, including the acquisitions Intercontinental Fragrances and Manheimer Fragrances, sales reached the previous year’s mark. At local exchange rates Scent & Care’s sales were up by 3%. Excluding Intercontinental Fragrances and Manheimer Fragrances, sales fell slightly by 0.7% to € 666.8 million (+ 2.2% on a local currency basis). Including Chr. Hansen Flavors, Flavor & Nutrition recorded sales of € 648.1 million in 2008, an increase of 7.4% (10.4% at local rates). Excluding Chr. Hansen Flavors, sales rose by 2.4% to € 617.5 million (5.0% on a local currency basis). After the acquisition in April, Chr. Hansen flavors posted sales of € 30.6 million."
Givaudan Full Year 2008 Sales Results - Geneva, 17 February 2009. In 2008, Givaudan group sales totalled CHF 4,087 million, an increase of 6.7% in local currencies and a decrease of 1.1% in Swiss francs compared to 2007. On a pro forma basis, excluding the impact of the ongoing portfolio streamlining, sales increased by 2.5% in local currencies. Including this effect, sales on pro forma basis increased by 1.0% in local currencies and decreased by 6.4% in Swiss francs. Fragrance Division sales were CHF 1,898 million, an increase of 7.9% in local currencies and a decrease of 0.1% in Swiss francs versus 2007. On a pro forma basis, and, excluding the impact of discontinued ingredients, sales grew by 1.7% in local currencies. Sales of the Flavour Division were CHF 2,189 million, an increase of 5.8% in local currencies and a decrease of 2.0% in Swiss francs compared to the previous year. On a pro forma basis, and, excluding the streamlining of commodity ingredients and the St. Louis divestment, sales increased by 3.1% in local currencies.
IFF Full Year 2008 Sales Results - Feb. 5, 2009 - Full year 2008 reported sales totaled $2,389 million, up 5% from 2007; Flavor and Fragrance sales increased 9% and 2%, respectively. 2008 sales benefited from the weaker U.S. dollar for most of the year. At comparable exchange rates, sales would have increased 2% over the prior year. Net Income was $230 million versus $247 million in 2007. The change is mainly attributable to $32 million of higher interest expense in 2008, partially offset by higher volume and favorable currency impacts. 4th Qtr. Sales in local currency increased 2% versus the comparable period in 2007, whereas reported sales of $539 million were down 3% due to the strengthening U.S. dollar. 4th Qtr. flavor sales were up 3% in local currencies while reported sales worldwide declined 1%, reflecting the stronger U.S. dollar. Fragrance sales in local currency were flat versus the comparable period last year, while reported sales were down 4%.
Sensient F&F Full year 2008 Sales Results - Feb. 5, 2008 -Sensient Flavors & Fragrances reported record revenue and operating income in 2008. Annual revenue for the Group increased 5.4% to $809.6 million, compared to $768.1 million in 2007. As these figures include dehydrated products such as dehydrated vegetables that are about 27% of sales, we estimate that the sales of conventional flavors & fragrances in 2008 were about $591 million. Operating income in 2008 was up 7.6% to $123.5 million, compared to $114.7 million in 2007. For the 4th Qtr. F&F revenue was $193.5 million, off 1.2% compared to 4th quarter 2007 revenue of $195.8 million. Quarterly operating profit of $29.2 million was down 1.8% compared to prior year fourth quarter operating income of $29.7 million. Quarterly revenue and operating income on a local currency basis increased 5.8% and 5.4%, respectively. The stronger US dollar currency translation reduced reported revenue and operating income for the Flavors & Fragrances Group by approximately 7% in the 4th quarter.
Robertet Sales for 2008 - Jan 20, 2009 - For the full year 2008, sales increased 25.7% to 303.17 Million Euros, reflecting the full year integration of the Charabot sales.
Mane 2008 Sales - Sales for the full year 2008 rose to 332.5 million Euros, an increase of 8.2% year over year (personal communication).
Takasago Year 2008/9 Sales Projections - Feb. 12, 2009 - Takasago has reduced its sales projections for the full fiscal year 2008/2009 ending Mach 31 to ¥122,000 million.
T. Hasegawa 2008 Sales Results - for the full year ending September 30, 2008 consolidated net sales were ¥ 45,421,000, down 9.3%. For the same period, net profit declined 46% to ¥ 2,238,000.
Firmenich 2007-2008 Sales - Oct. 9, 2008 - Firmenich posted strong sales growth for its fiscal year ended June 30, 2008, despite an economic downturn during the second half of the year. Sales increased 18.4% in local currencies, 13.5% in Swiss Francs, to reach an annual turnover of CHF 2,847 million. In our table, these are listed as "2007" sales.
Rank is based on US$
equivalents
(1) Estimated 1999 Total World Flavor &
Fragrance Sales of US $12.9 Billion. Again in year 2000, we
estimate that sales growth in local currencies was about 3-4%, but
the continued strengthening of the U.S. dollar against major
currencies once again leaves the estimated total market in U.S.
dollars at about U.S 12.9 Billion. For 2001 we believe that growth in
local currencies was about 2% or less and that in US $ equivalents
the market shrank to about U.S $12.7 Billion based on the strength of
the dollar. For 2002, we estimate that the total world market is
$15.1 billion. This sizable increase reflects a decrease in the value
of the U.S. dollar of about 17.8% vs. major currencies at 12/31/02 vs
12/31/01. The continued weakness of the U.S. dollar in 2003 against
the worlds major currencies (a decline of about 16%) again has
affected the size of the total market in U.S. dollars (the 2003
estimate being about U.S. $16.3 billion). For 2004, the U.S. $ was
again down about 5-6% against major currencies. We estimate that
growth in local currencies was about 3% resulting in a total market
size of about U.S. $17.7 billion. For 2005, the U.S. $ strengthened
by about 12% against major currencies. We estimate that growth in
local currencies was about 3% in 2005 resulting in a total market
size of about U.S. $16.0 billion. For 2006, the US $ declined in
value against the world's major currencies by about 9%. We estimate
that growth in local currencies was about 3-4% resulting in a total
market size of about U.S. $18 billion.
For 2007, the US $ again declined in value
against the world's major currencies by about 5.8%. For 2007, we
estimate that growth in local currencies was about 4.5% resulting in
a total market size of about U.S. $19.8 billion.
In 2008, based on comparison of major currency rates (on Dec.31), the U$ $ had a decline of 6% against the Swiss Franc, a 23% decline against the Japanese Yen and about a 5% gain aganst the Euro. However, comparing single points in time can be somewhat misleading as during the period of March to August 2008, the dollar had a decline of about 26% against the Euro in the same prior year period. In addition, the deteriorating worldwide economic situation during the last 1/3 of the year negatively impacted sales volumes. At best we estimate that the total market grew in 2008 at about 2.5-3.0% in US $.
It should be noted that Givaudan in 2001 estimated the total F&F market at "roughly" 15 billion CHF (U.S. $ 8.7 billion) while in a market study (April , 2001) ChemSynergy estimates the market for flavor and fragrance products is at present globally in the order of $12.24 billion. Also in a market study by The Freedonia Group, they estimated the world F&F market as $14.15 billion in 1999 with a projected growth to $18.4 billion by 2004. Get a copy of the Freedonia Press Release.
For a historical review of Total Market Size, see below.
Lazlo Unger, an economist at Givaudan , estimated the world F&F market at US 4.0 billion in 1979, 4.2 billion in 1981 (Source: Perfumer & Flavorist, Vol. 7, August/September, 1982, p. 52) and 7.0 billion in 1987 (Source: Perfumer & Flavorist, Vol .14, May/June, 1989, p. 43). Hans Hartmann of H&R estimated the world F&F market at US $ 7.8 billion in 1990 and 9.6 billion in 1995 (Source: Perfumer & Flavorist, Vol. 23, March/April, 1996, p. 22), and the flavor market (only) at 4.5 billion in 1994 (Source: Perfumer & Flavorist, Vol . 20, September/October, 1995, p. 35).
For information, Chemical & Engineering News (for 2002) and Unger (for 1987) estimated world F&F sales by category as follows:
|
|
|
|
|
Fragrance compounds |
|
|
|
Flavor compounds |
|
|
|
Aroma Chemicals |
|
|
|
Essential Oils & Other Natural Products |
|
|
Takasago 2006-2007 Record Sales - May 15, 2007 - Sales for the fiscal year ending March 31st were ¥113,876 million, up 7.7% from the prior year. Net income increased 68% to ¥ 4,885 million.
Givaudan 2006 Sales - February 20, 2007 - Geneva, Switzerland, 20 February 2007. In 2006, Givaudan’s total sales increased to CHF 2,909 million, representing a 4.7% rise in Swiss Francs and a 3.5% rise in local currencies. Despite the continued ingredients streamlining in both divisions, the company continued to deliver above market sales growth for the sixth consecutive year. This streamlining impacted annual sales by CHF 33 million. Without this effect, sales in local currencies would have increased by 4.9%
Takasago 3d Qtr 2006 Results - Feb. 13, 2007 - Gross Sales for the period April 1- December 31, 2006 increased 6.7% to ¥84,136,000. Operating profit for the same period increased 10% to ¥5,274,000.
Robertet 2006 Sales - reported 2006 sales were 221,127 million euros, an increase of 6.8% over 2005 sales.
Symrise 2006 Sales - Feb. 6, 2007 - Symrise has reported preliminary sales results for 2006 of 1,230.0 million euros, up 7% from 2005. Preliminary EBITDA for 2006 was reported as 243.0 million euros, up 25.8%.
Quest 4th Qtr & full year 2006 Sales - Feb. 8, 2007 - Quest's 4th Qtr. sales increased 2.9% to 143 £m while full year 2006 sales were up 5% to 588 £m. 4th Qtr trading profit increased 36% to 15 £m while full year 2006 trading profit was up 7% to 76 £m.
Sensient F&F 4th Qtr & full year 2006 Sales - Feb. 12, 2007 - Sensient's Flavors & Fragrances Group achieved record results in 2006, as revenue for the twelve months increased 9.4% to $733.4 million and operating income increased 26.7% to $104.5 million. Flavors & Fragrances Group revenue grew 9.4% to $185.0 million in the quarter ended December 31, 2006, compared to $169.1 million in the prior year's fourth quarter. Quarterly operating income jumped 42.8% to $27.0 million compared to $18.9 million in the fourth quarter of 2005. As approximately 23% of F&F sales historically has been in dehydrated vegetables, we estimate that Sensient's true F&F sales were about $565 million for year 2006.
IFF 4th Qtr & Full Year 2006 Results - New York, N.Y., January 30, 2007 … Fourth quarter 2006 sales totaled $514 million, up 11% from the prior year quarter; fragrance and flavor sales increased 13% and 7%, respectively. Sales for the 4th quarter benefited from the generally weaker U.S. dollar; at comparable exchange rates, sales would have increased 7% in comparison to the 2005 quarter. Net income for the 2006 fourth quarter, including $1 million in after tax restructuring charges, totaled $44 million, a 192% increase compared with the prior year quarter. The 2005 fourth quarter result of $15 million included restructuring charges of $16 million after tax. Excluding the restructuring charges from both years, net income increased 48% in the 2006 fourth quarter. Sales for the full year 2006 increased 5 percent to $2.10 billion from $1.99 billion in the prior year. For year 2006, fragrance sales increased 5% and flavors increased 4%. Net income for 2006, including $2 million in after tax restructuring charges, totaled $223 million, a 15% increase compared with the prior year. Full year 2005 results of $193 million included restructuring charges totaling $16 million after tax, as well as a tax benefit of $25 million relating to repatriation of funds from overseas affiliates. Excluding the restructuring charges from both years and the one-time tax benefit from 2005, net income in 2006 increased 22% versus the comparable 2005 result.
T. Hasegawa 2006 Sales Results - for the full year ending September 30, 2006 consolidated net sales were ¥47,000,000, down 1.6% while consolidated net income declined 4.35% to ¥ 3,713,000.
Disclaimer: The figures reported are
derived from reliable published sources and represent our
best estimates. We disclaim any material interest in any of
the companies for which information is provided. Statements
presented here which are not historical facts or information
must be considered "forward-looking statements" within the
meaning of the Private Securities Litigation Reform Act of
1995, and are subject to risks and uncertainties that could
cause a company's actual results to differ materially from
those expressed or implied by such forward-looking
statements. Risks and uncertainties with respect to a
company's business include general economic and business
conditions, the price and availability of raw materials, and
political and economic uncertainties, including the
fluctuation or devaluation of currencies in countries in
which a company does business. Investors should not accept
any information presented here as fact without independent
verification. If errors are found in our market analysis, we
would gratefully accept factual corrections. This information is provided gratis as a
service to those in the Flavor & Fragrance
industry.
Comments on Total Market Size (2006-2018)
Leffingwell & Associates includes "ingredient" sales in their sales estimations, some of which run through the sales of the major F&F companies (e.g. especially Givaudan, Firmenich, Symrise, Takasago & IFF). It should be obvious that other F&F suppliers such as Kerry, Huabao International, Ogawa, KAO, BASF., Rhodia. Citrus & Allied. Symrise (Pinova Holdings, Inc. (including Renessenz)), Bell Flavors & Fragrances, Wild Flavors, Camphor & Allied Products, Shiono Koryo Kaisha, Nagaoka Perfumery, plus the other ~400 F&F companies, are important to the total market size. One of the controversial problems in estimating total market size has to do with potential (or real) double counting of sales. This is a particular issue in the case of "ingredients". For example - in the case of essential oils and aroma chemicals they are often sold twice, e.g., the producer sells to a company which then sells to another company. For essential oils, these often require a distillation and standardization before the are ready for the end user F&F company. Or in the case of aroma chemical producers, they may sell to another company (in bulk) who then repackages in smaller containers for further sale. These multiple transactions are considered by Leffingwell as being "value added" for the ultimate F&F customer and are therefore included in our figures for total market size.
It should be noted in 2005 Freedonia projected that the F&F market size would be about $18.6 billion by 2008 (http://www.freedoniagroup.com/brochure/18xx/1886smwe.pdf) and that Business Insights estimated the F&F market to be $18 billion in 2006 (http://www.globalbusinessinsights.com/content/rbig0001m.pdf). Similarly, in 2005 Frost and Sullivan estimated that the top five suppliers accounted for approximately 54 percent of the total F&F revenues (which translates to a slightly higher estimate for the total market size than the Leffingwell estimate). See http://www.frost.com/prod/servlet/report-overview.pag?repid=B722-01-00-00-00&ctxst=FcmCtx1&ctxht=FcmCtx2&ctxhl=FcmCtx3&ctxixpLink=FcmCtx4&ctxixpLabel=FcmCtx5
However, we are aware that IAL Consultants (see below) estimates the 2006 market size at about $12.6 billion and that Firmenich estimated that for 2006-2007 that the total market size was closer to US$15 billion. Similarly, Givaudan has estimated the total market size at about CHF 17-18 billion (about US $16.9-17.9 billion) for 2008 ( see http://www.givaudan.com/staticweb/StaticFiles/GivaudanExtranet/Publications/fin_pubs/fy_report/2008/givaudan_2008_fy_an_fn.pdf ). Some of these discrepancies may arise from the "double counting" of sales issue discussed above.
A recent report on the size of the Essential oil and Aroma chemical market size is of interest.
BCC Research reports on the
2006 market for Essential oils and Aroma chemicals at http://www.bccresearch.com/report/CHM034B.html
BCC Research reports
"The worldwide flavors and fragrance
"ingredient"
market is estimated to be worth
approximately $6.3 billion in 2006. Poised for an average
annual growth rate (AAGR) of 4.5% per year, this value should grow to
$7.8 billion in 2011. Flavors and fragrances have similar economic
and operational characteristics, including research and development,
the nature of the creative and production processes, the manner in
which the products are distributed and the preferences of the
customers. World demand for quality essential oils and their
derivatives is likely to see increasing demand in the coming years,
and natural products will continue to remain an important part of the
flavors and fragrances industry. The market should reach $5.0 billion
by 2011, an AAGR of 5.2%."
............................................................. Estimated 2006 Worldwide Essential Oil & Aroma Chemical Sales
...............................................................
...............................................................Source;
BCC Research Report ID:CHM034B, Published: December 2006,
Analyst: N. S. Venkataraman
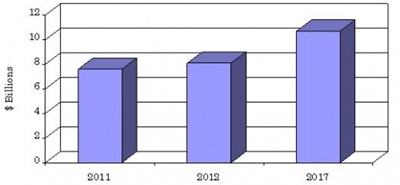
The flavor and fragrance industry's total demand for ingredients was an estimated $7.6 billion in 2011 and growing at a projected CAGR of 5.7%. At this rate, the market should reach $8.1 billion in 2012 and $10.7 billion by 2017 (Source: BCC Research at http://www.bccresearch.com/report/flavors-fragrances-global-markets-chm034c.html)
November 2014 - A Press Release from IAL Consultants estimated the World F&F market at $21.4 billion. See http://www.ialconsultants.com/uploads/CUBE_new_reports/2014-11-06/FF2014Leaflet.pdf
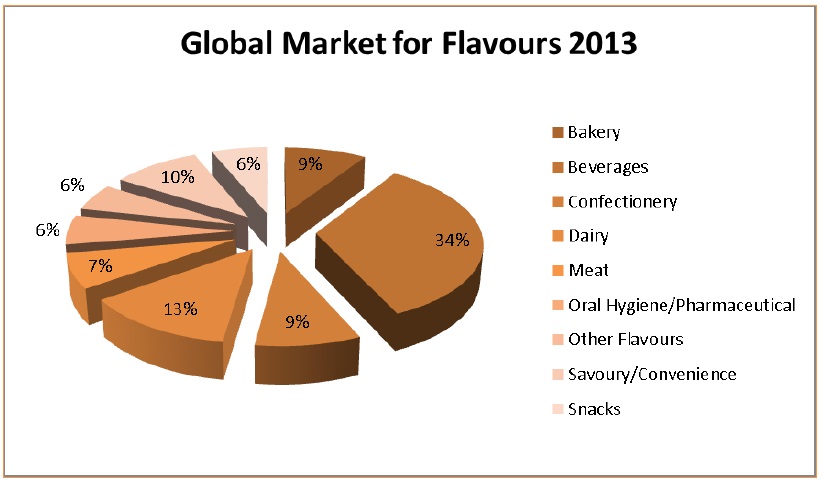
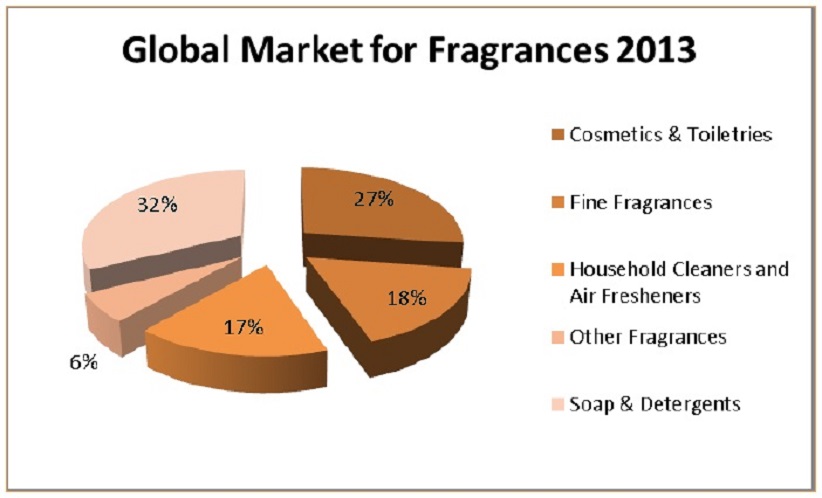
April 16, 2007 - A Press Release from
IAL Consultants estimated the World F&F market at $12.6 billion.
As their figures for the total market are close to that firmly
documented for the top ten companies, they must be excluding
much of the sales of the nearly 400+ other companies in the
F&F Industry. The following charts shows their estimates as
to the market breakdown. See http://www.ialconsultants.com/website/pdf/8289P.pdf
...... ..........
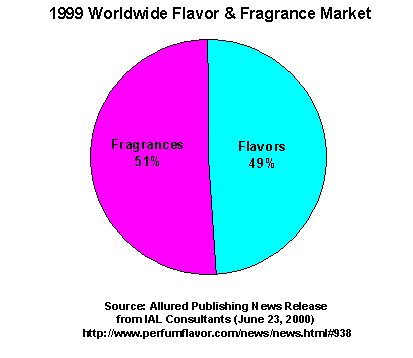
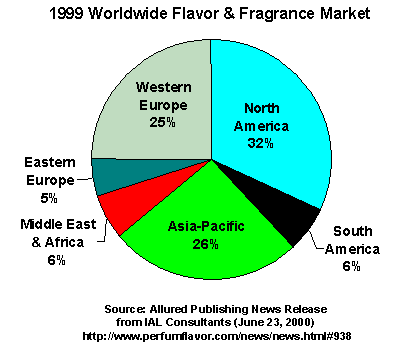
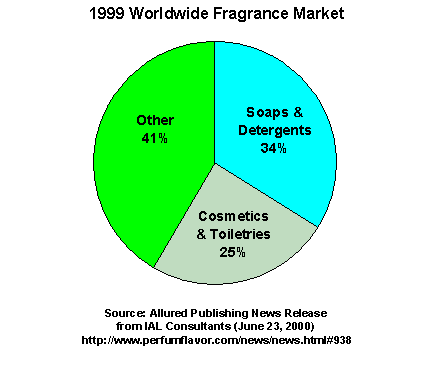
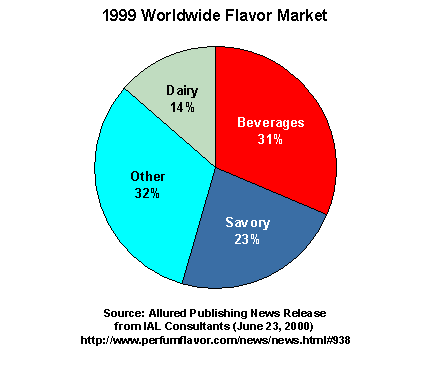
June 23, 2000 - A press release from
IAL Consultants estimated the World F&F market at $10.4
billion. The following charts shows the estimates as to the market
breakdown.
Copyright © 2000-2016 by Leffingwell & Associates
General Notice: Leffingwell & Associates strives to ensure that the information contained in this Web site is accurate and reliable. However, Leffingwell & Associates and the Web Master are not infallible, and errors may sometimes occur. Therefore, Leffingwell & Associates disclaims any warranty of any kind, whether express or implied, as to any matter whatsoever relating to this Web site, including without limitation the merchantability or fitness for any particular purpose. Leffingwell & Associates will from time to time revise the information, services and the resources contained in this Web site and reserves the right to make such changes without any obligation to notify past, current or prospective visitors. In no event shall Leffingwell & Associates be liable for any direct, indirect, special, incidental, or consequential damages arising out of any use of the information contained herein.
The Information contained in or provided from or through this web site is not intended to be and does not constitute financial advice, investment advice, trading advice or any other advice. The Information on this web site and provided from or through this web site is general in nature and is not specific to you the User or anyone else. You should not make any decision, financial, investments, trading or otherwise, based on any of the information presented on this forum without undertaking independent due diligence and consultation with a professional broker or competent financial advisor. You understand that you are using any and all Information available on or through this forum at your own risk. RISK STATEMENT - The trading of stocks, futures, commodities, index futures or any other securities has potential rewards, and it also has potential risks involved. Trading may not be suitable for all users of this Website. Anyone wishing to invest should seek his or her own independent financial or professional advice.
|
|