|
Leffingwell &
Associates
|
Alchemist WebPick Awarded by the webzine of ChemWeb.com  |
2003 - 2007 Estimated Sales Volume in
Millions
(Final Estimate as of October 9, 2008)
|
Leffingwell &
Associates
|
Alchemist WebPick Awarded by the webzine of ChemWeb.com |
2003 - 2007 Estimated Sales Volume in
Millions
(Final Estimate as of October 9, 2008)
.. Company 2003 2003 Est. 2003 2004 2004 Est. 2004 2005 2005 Est. 2005 2006 2006 Est. 2006 2007 2007 Est. 2007 ... Rank .. Country Currency =US $ Market Share1 Country Currency =US $ Market Share1 Country Currency =US $ Market Share1 Country Currency =US $ Market Share1 Country =US $ Market Share1 Source 1 Givaudan 2,715 CHF $2194.1 13.5% 2,680 CHF $2,346.9 13.3% 2,778 CHF $2,108.9 13.2% 2,909 CHF $2,387.9 13.3% 4,132 CHF $3,647.0 18.4% 2(3) Firmenich 1,976 CHF $1596.9 9.8% 2,035 CHF $1,782.1 10.1% 2,308 CHF $1,752.1 11.0% 2,500 CHF $2,052.1 11.4% 2,847 CHF $2,512.8 12.7% 3 IFF $1901.5 $1901.5 11.7% $2,033.7 $2,033.7 11.5% $1,993.4 $1,993.4 12.5% $2,095.4 $2,095.4 11.6% $2,276.6 $2,276.6 11.5% 4 Symrise 1160.4 � $1462.2 9.0% 1,138.1 � $1540.3 8.7% 1,148.9 � $1,360.2 8.5% 1,230.0 � $1,623.0 9.0% 1,274.5 � $1,860.8 9.3% 5(4) Takasago ¥96,161 $897.7 5.5% ¥101,205 $985.1 5.6% ¥105,721 $898.3 5.6% ¥113,876 $955.7 5.3% ¥124,231 $1,112.0 5.6% 6(6) Sensient Flavors $452.0** $452.0** 2.8% $499.2** $499.2** 2.8% $516.4** $516.4** 3.2% $535.4** $535.4** 3.0% ~$572** ~$572** 2.9% 7 Mane SA 246.2 � $310.2 ~1.9% 255 � $345.1 2.0% 263 � $311.4 1.9% 288 � $380.0 2.1% 307.31 � $448.7 2.3% 8(5) T. Hasegawa ¥46,465 $433.8 2.7% ¥50,381 $490.4 2.8% ¥47,752 $405.7 2.5% ¥47,000 $394.4 2.2% ¥50,066 $448.1 2.3% 9 Frutarom $139.3 $139.3 0.9% $196.8 $196.8 1.1% $243.8 $243.8 1.5% $287.2 $287.2 1.6% $368.3 $368.3 1.9% 10 Robertet SA 202.1 � $254.7 1.6% 203.7 � $275.7 1.6% 207 � $245.1 1.5% 221.13 � $291.8 1.6% 241.14 � $352.1 1.8% ... Top Ten Totals ... $10,554.7* 64.75%* ... $11,469.4* 64.96%* ..... $10,555.0* 66.0%* .. $11,867.6* 65.9%* .. $13,598.4 68.7% ... All Others ... $5,745.3 ... ... $6,188.0 35.04% ... $5,445.0 34.0% .. $6,132.4 34.1% .. $6201.6 31.3% ... Total Market ... $16,300 ... ... $17,657.4 ... .. $16,000 ... .. $18,000 .. .. $19,800 .. ...
* Note - Top 10 Total figures includes Quest International for Years
2003-2006 and excludes sales of Frutarom for the same period, as 2007
was Frutarom's 1st year in the Top 10.
Currency
Sales results for 1999 to 2002 are available HERE and for 2002 to 2006 click HERE. These tables include Quest International in the Top 10 for years 1999-2006.
Firmenich 2007-2008 Sales - Oct. 9, 2008 - Firmenich posted strong sales growth for its fiscal year ended June 30, 2008, despite an economic downturn during the second half of the year. Sales increased 18.4% in local currencies, 13.5% in Swiss Francs, to reach an annual turnover of CHF 2,847 million.
Takasago Year 2007/8 Sales - May 15, 2008 - Takasago sales for the Year ending March 31, 200 increased 9.1 % to ¥ 124,231 million while net income increased +6.2% to ¥ 5,188 million.
Frutarom 12 Month 2007 Sales - Haifa, Israel, March 18 - For the full year, Frutarom sales totaled US$ 368.3 million, up 28.2% compared with 2006. On a pro forma basis (assuming that acquired companies had been consolidated as of January 1, 2007), sales for 2007 totaled US$ 431.5 million, which is growth of 50% compared with 2006. Fourth quarter sales grew sharply by 49.2% to total US$ 108.4 million. Net profit for the fourth quarter of the year rose to US$ 5.2 million compared with US$ 4.2 million in the fourth quarter of 2006. Net profit for 2007 totaled US$ 24.2 million compared with US$ 29.7 million in 2006. The actual full year sales increase placed Frutarom as the No. 9 industry sales leader.
Symrise 12 Month 2007 Sales - Holzminden, March 5, 2008 - Symrise total 2007 sales increased 3.7% to � 1,274.5 million. In local currencies, sales increased 6.2%. Scent & Care division sales increased 3.7% to � 671.3 million (+6.5% in local currencies). Flavor & Nutrition sales increased 3.6% to � 603.2 million (+5.8% in local currencies). Overall Net income for the year rose to � 97 million, following a loss of � 90 million in the previous year.
Givaudan 12 Month 2007 Sales - Geneva - Feb. 19, 2007, In 2007, Givaudan's total sales increased to CHF 4,132 million from CHF 2,909 million in the previous year. This resulted in a growth of 42.2% in local currencies and 42.0% in Swiss francs. These sales include the acquisition of Quest International as of 2 March 2007.
IFF 2007 Sales Results - New York - January 30, 2008 - For the full year 2007, IFF sales increased 9% to $2,276.64 million and net income increased 9% to $ 247.128 million. For the fourth Qtr, sales were $553 million, up 8 percent from the prior year quarter. Sales for the 2007 quarter benefited from the generally weaker U.S. dollar; at comparable exchange rates, sales would have increased 2 percent in comparison to the 2006 quarter. 4th Qtr 2007 Flavor sales increased 16% in $ (= +10% in local currencies) and Fragrance sales increased 2% in $ (= -3% in local currencies). For the full year 2007, Flavor sales increased 12% in $ (= +9% in local currencies) and Fragrance sales increased 6% in $ (= +2% in local currencies).
Sensient F&F 4th Qtr & full year 2007 Sales - Feb. 11, 2008 - Sensient's Flavors & Fragrances Group achieved record results in 2007, as revenue for the twelve months increased 6.9% to $783.7 million and operating income increased 12.3% to $117.3 million. Flavors & Fragrances Group revenue grew 7.7% to $199.4 million in the quarter ended December 31, 2007, compared to $185.0 million in the prior year's fourth quarter. Quarterly operating income jumped 11.3% to $30.1 million compared to $27.0 million in the fourth quarter of 2006. As about 27% of F&F sales are in dehydrated vegetables, we estimate that Sensient's true F&F sales were about $572 million for year 2007.
T. Hasegawa 2007 Sales Results - for the full year ending September 30, 2007 consolidated net sales were ¥50,066,000, up 6.5% while consolidated net income increased 11.7 % to ¥ 4,147,000.
With the acquisition of Quest by Givaudan in early 2007, the sales of Quest are now part of Givaudan since March 2007.
The acquisition of Danisco Flavors by Firmenich in 2007 moves them to the No. 2 sales leader.
Robertet's sales includes those of the Charabot acquisition for
4th Qtr 2007.
Robertet
Sales for 2007 - Jan 21, 2008 - 4th Qtr
sales rose to 73.67 Million Euros (+52.6%) reflecting the integration
of Charabot in the quarter. For the full year 2007, sales increased
9% to 241.14 Million Euros.
Mane 2007 Sales - Sales for the full year 2007 rose to 307.31 million Euros, an increase of 6.7% year over year (personal communication).
Note - It is quite possible that Mastertaste (Kerry Ingredients) should be included as one of the Top Ten. However, there is a lack of firm sales data information, as the company has not made these disclosures.
Rank is based on US$
equivalents
(1) Estimated 1999 Total World
Flavor & Fragrance Sales of US $12.9 Billion. Again in year
2000, we estimate that sales growth in local currencies was about
3-4%, but the continued strengthening of the U.S. dollar against
major currencies once again leaves the estimated total market in U.S.
dollars at about U.S 12.9 Billion. For 2001 we believe that growth in
local currencies was about 2% or less and that in US $ equivalents
the market shrank to about U.S $12.7 Billion based on the strength of
the dollar. For 2002, we estimate that the total world market is
$15.1 billion. This sizable increase reflects a decrease in the value
of the U.S. dollar of about 17.8% vs. major currencies at 12/31/02 vs
12/31/01. The continued weakness of the U.S. dollar in 2003 against
the worlds major currencies (a decline of about 16%) again has
affected the size of the total market in U.S. dollars (the 2003
estimate being about U.S. $16.3 billion). For 2004, the U.S. $ was
again down about 5-6% against major currencies. We estimate that
growth in local currencies was about 3% resulting in a total market
size of about U.S. $17.7 billion. For 2005, the U.S. $ strengthened
by about 12% against major currencies. We estimate that growth in
local currencies was about 3% in 2005 resulting in a total market
size of about U.S. $16.0 billion. For 2006, the US $ declined in
value against the world's major currencies by about 9%. We estimate
that growth in local currencies was about 3-4% resulting in a total
market size of about U.S. $18 billion. For
2007, the US $ again declined in value against the world's major
currencies by about 5.8%. For 2007, we estimate that growth in local
currencies was about 4.5% resulting in a total market size of about
U.S. $19.8 billion.
It should be noted that Givaudan in 2001 estimated the total F&F market at "roughly" 15 billion CHF (U.S. $ 8.7 billion) while in a market study (April , 2001) ChemSynergy estimates the market for flavor and fragrance products is at present globally in the order of $12.24 billion. Also in a market study by The Freedonia Group, they estimated the world F&F market as $14.15 billion in 1999 with a projected growth to $18.4 billion by 2004. Get a copy of the Freedonia Press Release.
For a more contemporary review of Total Market Size, see below.
(3) Accounting Period of July 1 to June
30
(4) Accounting Period of April
1 to March 31
(5)Accounting Period of Sept. 1
to August 31; Net sales given are Company consolidated sales, See
T.Hasegawa
Co., Ltd.
(6) Accounting Period of Sept.
1 to August 31 until year 2000. Information in Universal Foods 1999
Annual Report (available online) indicates UF Flavor sales for 1995
($371 million), 1996 ($359 million), 1997 ($321 million), 1998 ($347
million), and 1999 ($374 million). In year 2000, Universal Foods
changed is name to SENSIENT TECHNOLOGIES CORPORATION and the Flavor
division is now known as Sensient Flavors. In addition, the
accounting period was changed to January 1 - December 31 starting in
year 2000 and in the "funny" way of making one look larger than they
really are in F&F, Sensient's Flavor sales for 2000 now include
"Dehydrated Products" (onion/garlic/chilies/dehydrated vegetables)
which are not flavors or fragrances in the conventional sense.
In our figures for Sensient, we have removed sales for the
"Dehydrated Products".
Note - all foreign currency
calculations for the table are based on December
31 rates for the year
indicated
Note - for companies with
accounting periods that overlap calendar years, sales are stated for
the year in which the majority of sales periods occur. For example,
if Takasago's year end is March 31, 2002 we treat that as year 2001
sales. Similarly, if Firmenich's year end is June 30, 2002 we report
the year ending as 2001 sales. While not exact, we feel that this
treatment still provides an accurate overall basis for comparison.
Similarly, as noted, currency calculations are based on calendar year
end rates for comparison consistency. If fiscal year end rates were
employed the U.S. $ figures would be somewhat different, but totally
confuse comparisons.
Note - Top Ten Total for market share does
not add due to rounding for individual companies.
** See Note (6). F&F figures in the table above for Sensient Flavors are estimates as we have removed reported sales of "Dehydrated products" (27% of reported F&F revenues) from their stated "Flavor & Fragrance Sales" of $525.7 million for 2001; 26% of reported F&F revenues of $572.2 million for 2002; 24% of reported F&F revenues of $594.7 million 2003; 23% of reported F&F sales of $648.3 million (restated) in 2004 and 23% of reported F&F sales of $670.6 million in 2005 in order to have a reasonable year to year comparison. In 2006, dehydrated products were 27% of the reported F&F sales of $733.4 million making the true F&F sales about 535.4 million.
Lazlo Unger, an economist at Givaudan , estimated the world F&F market at US 4.0 billion in 1979, 4.2 billion in 1981 (Source: Perfumer & Flavorist, Vol. 7, August/September, 1982, p. 52) and 7.0 billion in 1987 (Source: Perfumer & Flavorist, Vol .14, May/June, 1989, p. 43). Hans Hartmann of H&R estimated the world F&F market at US $ 7.8 billion in 1990 and 9.6 billion in 1995 (Source: Perfumer & Flavorist, Vol .21, March/April, 1996, p. 22), and the flavor market (only) at 4.5 billion in 1994 (Source: Perfumer & Flavorist, Vol . 20, September/October, 1995, p. 35). Ron Fenn of IFF estimated the total F&F market in 1995 at about US $ 10 billion and projected a market of 12 billion in the year 2000 (Source: Perfumer & Flavorist, Vol .23, March/April, 1996, p. 11 ) in concurrence with (or based on) Hartmann's estimates.
For information, Chemical & Engineering News (for 2002) and Unger (for 1987) estimated world F&F sales by category as follows:
|
|
|
|
|
Fragrance compounds |
|
|
|
Flavor compounds |
|
|
|
Aroma Chemicals |
|
|
|
Essential Oils & Other Natural Products |
|
|
Takasago 2006-2007 Record Sales - May 15, 2007 - Sales for the fiscal year ending March 31st were ¥113,876 million, up 7.7% from the prior year. Net income increased 68% to ¥ 4,885 million.
Givaudan 2006 Sales - February 20, 2007 - Geneva, Switzerland, 20 February 2007. In 2006, Givaudan’s total sales increased to CHF 2,909 million, representing a 4.7% rise in Swiss Francs and a 3.5% rise in local currencies. Despite the continued ingredients streamlining in both divisions, the company continued to deliver above market sales growth for the sixth consecutive year. This streamlining impacted annual sales by CHF 33 million. Without this effect, sales in local currencies would have increased by 4.9%
Takasago 3d Qtr 2006 Results - Feb. 13, 2007 - Gross Sales for the period April 1- December 31, 2006 increased 6.7% to ¥84,136,000. Operating profit for the same period increased 10% to ¥5,274,000.
Robertet 2006 Sales - reported 2006 sales were 221,127 million euros, an increase of 6.8% over 2005 sales.
Symrise 2006 Sales - Feb. 6, 2007 - Symrise has reported preliminary sales results for 2006 of 1,230.0 million euros, up 7% from 2005. Preliminary EBITDA for 2006 was reported as 243.0 million euros, up 25.8%.
Quest 4th Qtr & full year 2006 Sales - Feb. 8, 2007 - Quest's 4th Qtr. sales increased 2.9% to 143 £m while full year 2006 sales were up 5% to 588 £m. 4th Qtr trading profit increased 36% to 15 £m while full year 2006 trading profit was up 7% to 76 £m.
Sensient F&F 4th Qtr & full year 2006 Sales - Feb. 12, 2007 - Sensient's Flavors & Fragrances Group achieved record results in 2006, as revenue for the twelve months increased 9.4% to $733.4 million and operating income increased 26.7% to $104.5 million. Flavors & Fragrances Group revenue grew 9.4% to $185.0 million in the quarter ended December 31, 2006, compared to $169.1 million in the prior year's fourth quarter. Quarterly operating income jumped 42.8% to $27.0 million compared to $18.9 million in the fourth quarter of 2005. As approximately 23% of F&F sales historically has been in dehydrated vegetables, we estimate that Sensient's true F&F sales were about $565 million for year 2006.
IFF 4th Qtr & Full Year 2006 Results - New York, N.Y., January 30, 2007 … Fourth quarter 2006 sales totaled $514 million, up 11% from the prior year quarter; fragrance and flavor sales increased 13% and 7%, respectively. Sales for the 4th quarter benefited from the generally weaker U.S. dollar; at comparable exchange rates, sales would have increased 7% in comparison to the 2005 quarter. Net income for the 2006 fourth quarter, including $1 million in after tax restructuring charges, totaled $44 million, a 192% increase compared with the prior year quarter. The 2005 fourth quarter result of $15 million included restructuring charges of $16 million after tax. Excluding the restructuring charges from both years, net income increased 48% in the 2006 fourth quarter. Sales for the full year 2006 increased 5 percent to $2.10 billion from $1.99 billion in the prior year. For year 2006, fragrance sales increased 5% and flavors increased 4%. Net income for 2006, including $2 million in after tax restructuring charges, totaled $223 million, a 15% increase compared with the prior year. Full year 2005 results of $193 million included restructuring charges totaling $16 million after tax, as well as a tax benefit of $25 million relating to repatriation of funds from overseas affiliates. Excluding the restructuring charges from both years and the one-time tax benefit from 2005, net income in 2006 increased 22% versus the comparable 2005 result.
T. Hasegawa 2006 Sales Results - for the full year ending September 30, 2006 consolidated net sales were ¥47,000,000, down 1.6% while consolidated net income declined 4.35% to ¥ 3,713,000.
Disclaimer: The figures reported are
derived from reliable published sources and represent our
best estimates. We disclaim any material interest in any of
the companies for which information is provided. Statements
presented here which are not historical facts or information
must be considered "forward-looking statements" within the
meaning of the Private Securities Litigation Reform Act of
1995, and are subject to risks and uncertainties that could
cause a company's actual results to differ materially from
those expressed or implied by such forward-looking
statements. Risks and uncertainties with respect to a
company's business include general economic and business
conditions, the price and availability of raw materials, and
political and economic uncertainties, including the
fluctuation or devaluation of currencies in countries in
which a company does business. Investors should not accept
any information presented here as fact without independent
verification. If errors are found in our market analysis, we
would gratefully accept factual corrections. This information is provided gratis as a
service to those in the Flavor & Fragrance
industry.
Comments on Total Market Size (2006-2007)
Leffingwell & Associates includes "ingredient" sales in their sales estimations, some of which run through the sales of the major F&F companies (e.g. especially Givaudan, Firmenich, Symrise, Takasago & IFF). It should be obvious that other F&F suppliers such as Mastertaste, AM Todd, Huabao International, Ogawa, Kao, BASF., Rhodia. Citrus & Allied. Millennium Specialty Chemicals div. of Lyondell, Bell Flavors & Fragrances, Cargill Flavor Systems, Camphor & Allied Products, Etol d.d, Shiono Koryo Kaisha, Nagaoka Perfumery (all with estimated sales in the range of about $50-250 million), plus the other ~400 F&F companies, are important to the total market size. One of the controversial problems in estimating total market size has to do with potential (or real) double counting of sales. This is a particular issue in the case of "ingredients". For example - in the case of essential oils and aroma chemicals they are often sold twice, e.g., the producer sells to a company which then sells to another company. For essential oils, these often require a distillation and standardization before the are ready for the end user F&F company. Or in the case of aroma chemical producers, they may sell to another company (in bulk) who then repackages in smaller containers for further sale. These multiple transactions are considered by Leffingwell as being "value added" for the ultimate F&F customer and are therefore included in our figures for total market size.
It should be noted in 2005 Freedonia projected that the F&F market size would be about $18.6 billion by 2008 (http://www.freedoniagroup.com/brochure/18xx/1886smwe.pdf) and that Business Insights estimated the F&F market to be $18 billion in 2006 (http://www.globalbusinessinsights.com/content/rbig0001m.pdf). Similarly, in 2005 Frost and Sullivan estimated that the top five suppliers accounted for approximately 54 percent of the total F&F revenues (which translates to a slightly higher estimate for the total market size than the Leffingwell estimate). See http://www.frost.com/prod/servlet/report-overview.pag?repid=B722-01-00-00-00&ctxst=FcmCtx1&ctxht=FcmCtx2&ctxhl=FcmCtx3&ctxixpLink=FcmCtx4&ctxixpLabel=FcmCtx5
However, we are aware that IAL Consultants (see below) estimates the 2006 market size at about $12.6 billion and that Firmenich estimated that for 2006-2007 that the total market size was closer to US$15 billion. Similarly, Givaudan has estimated the total market size at about CHF 17 billion (about US$15 billion) (see http://www.givaudan.com/givcom/jsp/channelViewUtil.jsp?channel=Our%20Company/Profile). Some of these discrepancies may arise from the "double counting" of sales issue discussed above.
A recent report on the size of the Essential oil and Aroma chemical market size is of interest.
BCC Research reports
on the 2006 market for Essential oils and Aroma
chemicals at http://www.bccresearch.com/report/CHM034B.html
BCC Research reports
"The worldwide flavors and fragrance
"ingredient" market is
estimated to be worth approximately $6.3 billion in
2006. Poised for an average annual growth rate
(AAGR) of 4.5% per year, this value should grow to $7.8 billion in
2011. Flavors and fragrances have similar economic and operational
characteristics, including research and development, the nature of
the creative and production processes, the manner in which the
products are distributed and the preferences of the customers. World
demand for quality essential oils and their derivatives is likely to
see increasing demand in the coming years, and natural products will
continue to remain an important part of the flavors and fragrances
industry. The market should reach $5.0 billion by 2011, an AAGR of
5.2%."
............................................................. Estimated 2006 Worldwide Essential Oil & Aroma Chemical Sales
...............................................................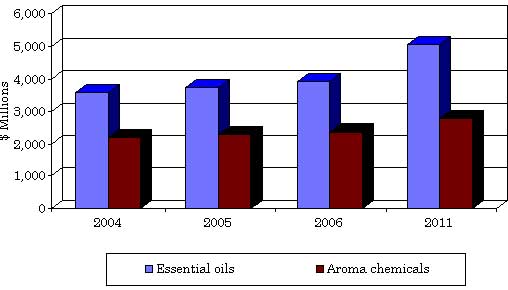
...............................................................Source;
BCC Research Report ID:CHM034B, Published: December 2006,
Analyst: N. S. Venkataraman
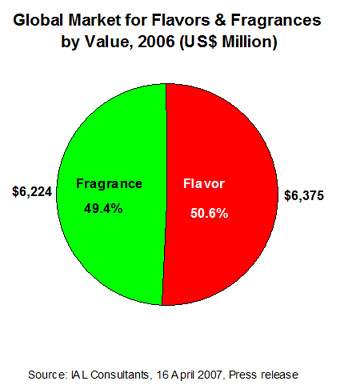
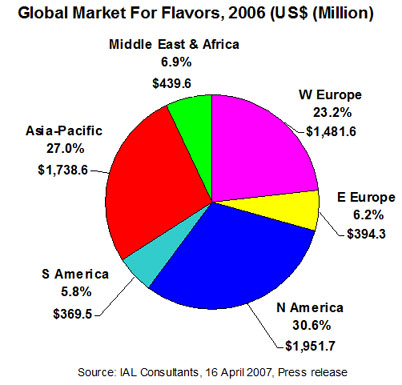
April 16, 2007 - A Press Release from IAL
Consultants estimated the World F&F market at $12.6 billion. As
their figures for the total market are close to that firmly
documented for the top ten companies, they must be excluding
much of the sales of the nearly 400+ other companies in the
F&F Industry. The following charts shows their estimates as
to the market breakdown. See http://www.ialconsultants.com/website/pdf/8289P.pdf
...... ..........
June 23, 2000 - A press release from
IAL Consultants estimated the World F&F market at $10.4
billion. The following charts shows the estimates as to the market
breakdown.
Copyright © 2000-2007 by
Leffingwell &
Associates
General Notice: Leffingwell &
Associates strives to ensure that the information contained in this
Web site is accurate and reliable. However, Leffingwell &
Associates and the Web Master are not infallible, and errors may
sometimes occur. Therefore, Leffingwell & Associates disclaims
any warranty of any kind, whether express or implied, as to any
matter whatsoever relating to this Web site, including without
limitation the merchantability or fitness for any particular purpose.
Leffingwell & Associates will from time to time revise the
information, services and the resources contained in this Web site
and reserves the right to make such changes without any obligation to
notify past, current or prospective visitors. In no event shall
Leffingwell & Associates be liable for any direct, indirect,
special, incidental, or consequential damages arising out of any use
of the information contained herein.